Understanding Evaluation Task by Accuracy

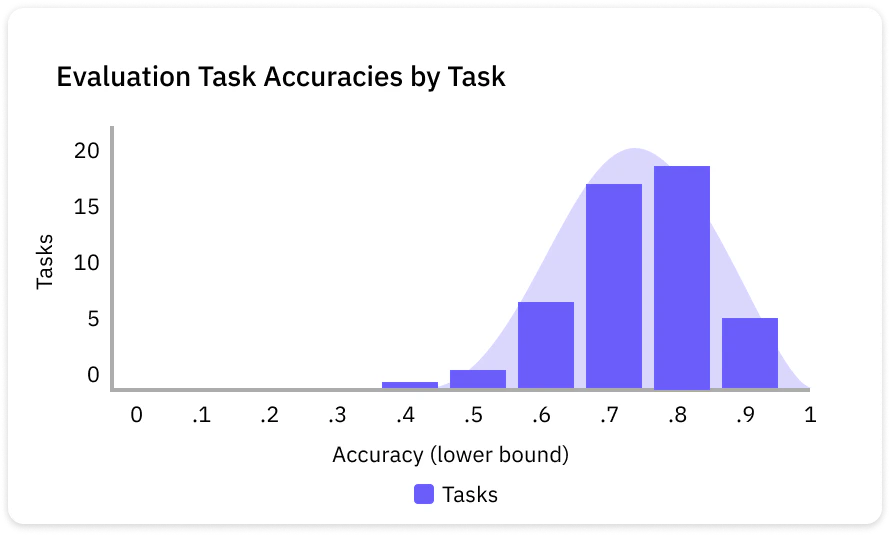
You find an overall picture of the accuracy of your project in Metrics.

Keep in mind that while Evaluation Task Accuracies are intended to represent your project as a whole, this is just a summative representation of the tasks you selected to be Evaluation tasks.

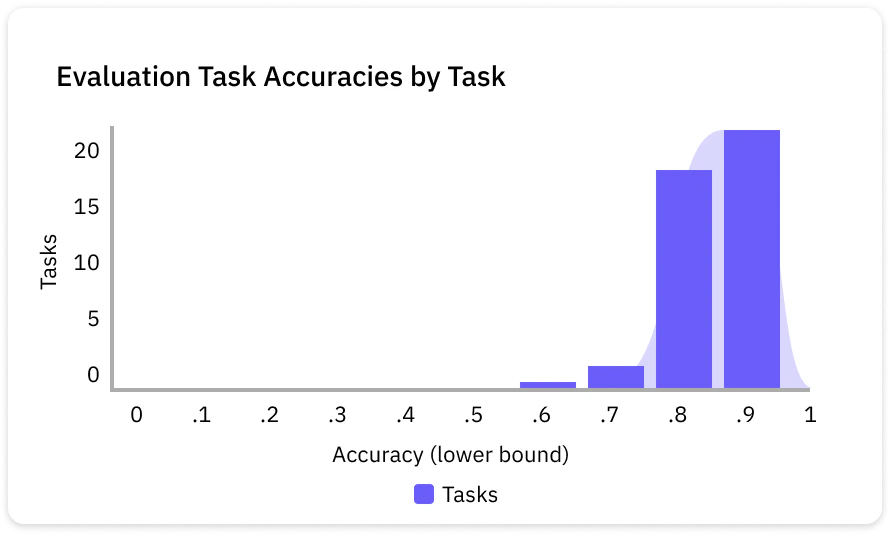
It is important to maintain a healthy set of evaluation tasks in order to get high quality data.

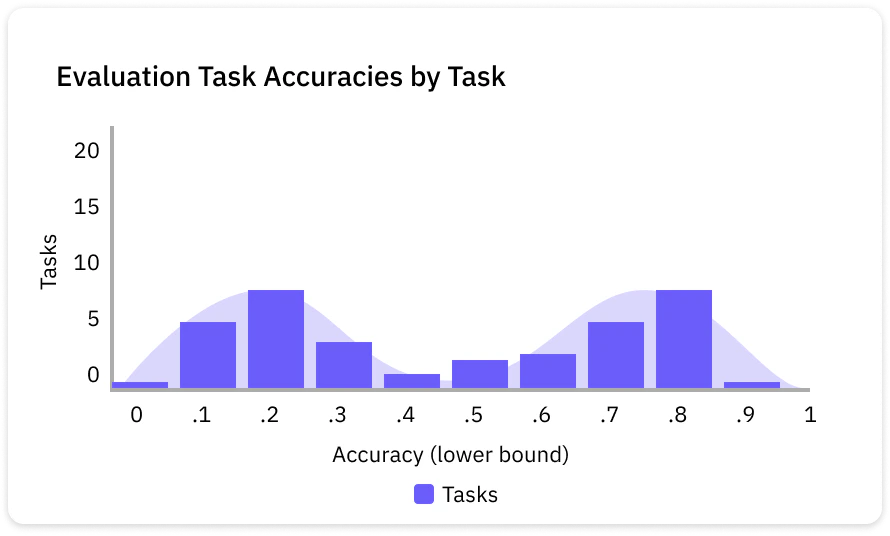
See more: Examples of various Evaluation Task curves and what they might indicate
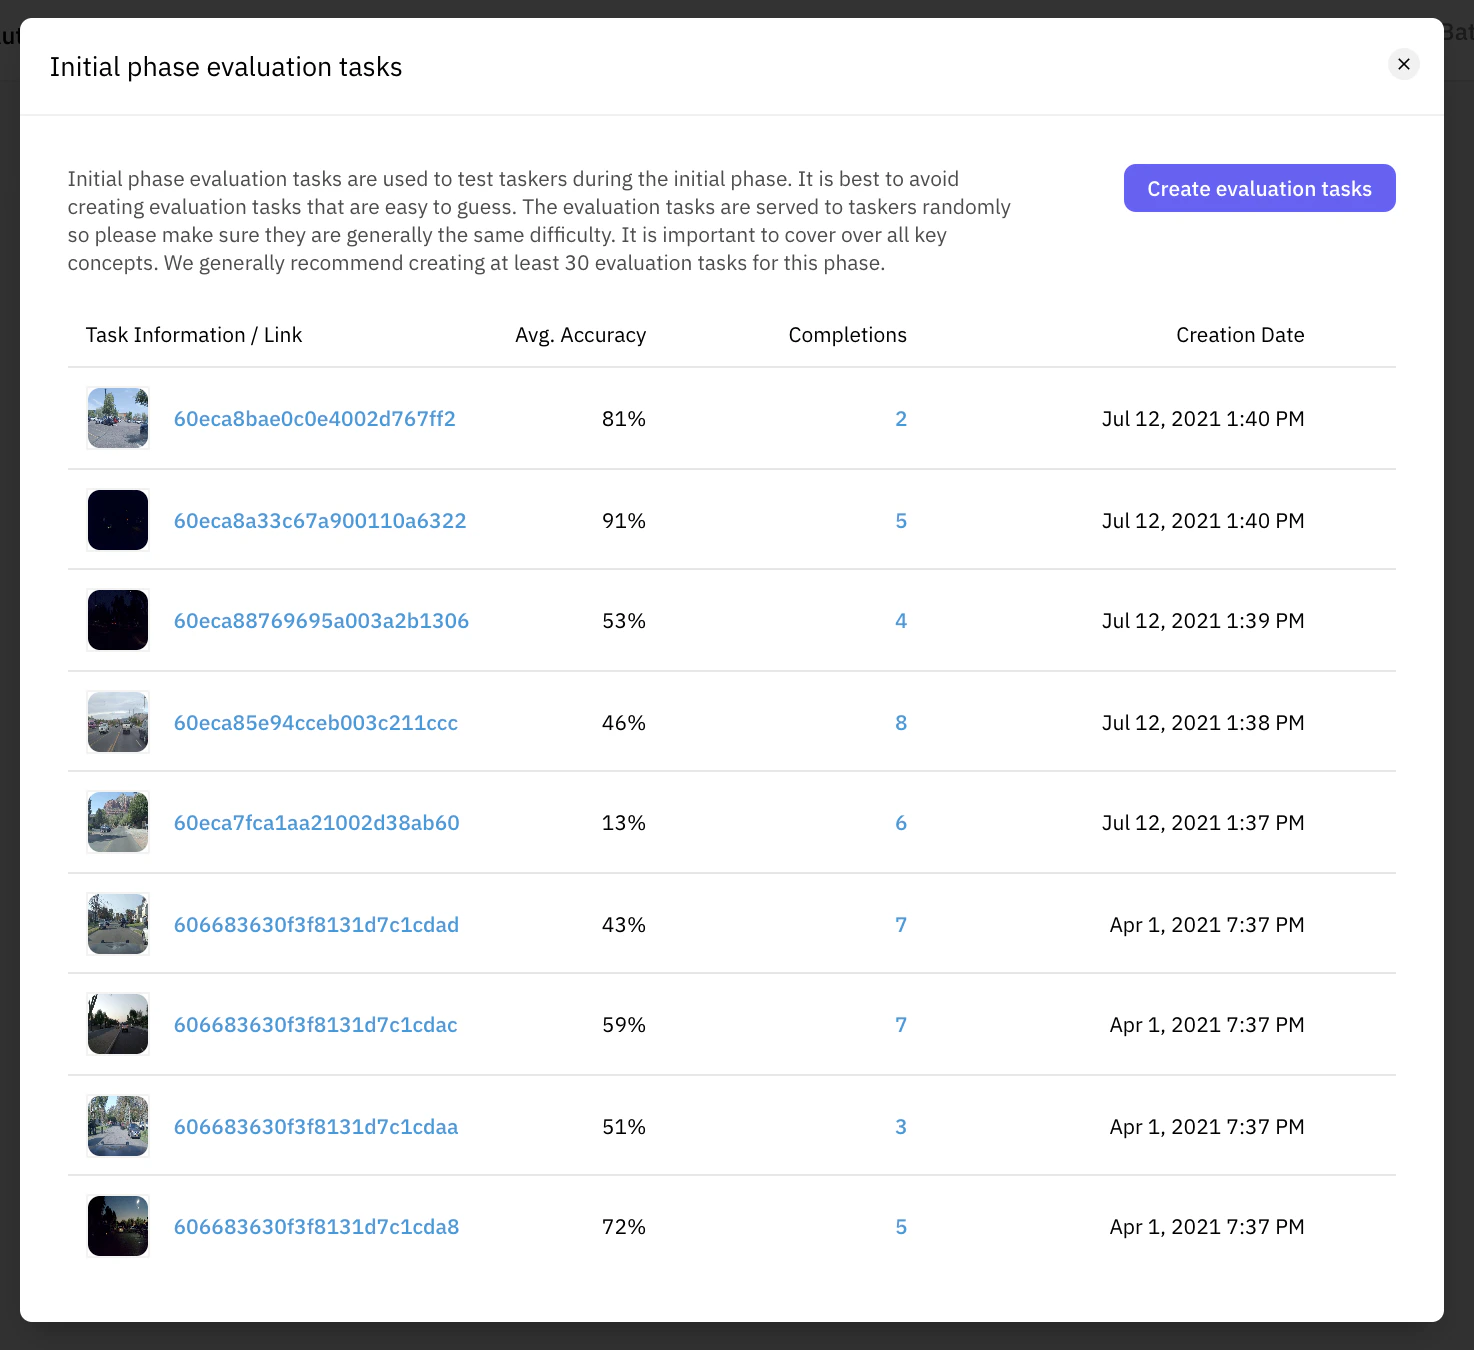
890

Most healthy projects will have an Evaluation Task curve that looks like a bell curve centered around 70-80% accuracy. This indicates that the evaluation is has good coverage of the difficulty and breadth of the potential tasks, and thus the Evaluation Tasks will ensure properly quality of Tasker workforce

890

This is an example of a set of Evaluation Tasks that has two centers on the low and high ends, ****which may be indicating at a problem with the project definition. If there are many Evaluation Tasks under 40% or so, it can indicate that you may want to refine your project instructions and taxonomy.

890

A set of Evaluation Tasks that result in a curve centered around high accuracy such as around 90% could indicate two things. One, your instructions could be clear and/or your dataset doesn't have too large of content breadth and difficulty - in this case this is healthy. Two, if you notice that your audit results don't really match up with the accuracy of evaluation tasks, it may indicate that you need to add additional "harder" evaluation tasks to maintain quality.

You will also be able to see individual accuracies at the Quality Lab view.

Diving into an evaluation task type will bring up each task and its average accuracy, as well as number of completions.

1474

Here you can inspect which tasks have better or worse average accuracies.

Updated 21 days ago