Remote Labor Index (RLI)
Overview
The Remote Labor Index (RLI) is a benchmark that empirically measures the capability of AI agents to perform real-world, economically valuable remote work. Current AI progress on research benchmarks, which often test isolated skills, provides limited insight into the trajectory of actual automation. RLI addresses this gap by evaluating AI agents on a broad, multi-sector collection of end-to-end projects sourced from professional freelance platforms and are grounded in genuine economic transactions. This allows a direct comparison of AI agent performance against a professional human-produced deliverable, providing a stable basis for tracking AI capabilities on practical work.
Read the paper here: scale.com/research/rli
Dataset Design & Sourcing
Each of the 240 projects is a self-contained unit sourced directly from experienced freelance professionals.
Each projects includes:
Brief: The text document describing the work.
Input Files: All files necessary to complete the project.
Human Deliverable: The gold-standard, professionally-accepted work.
Economic Data: The reported human completion time and cost.
Sourcing Strategy:
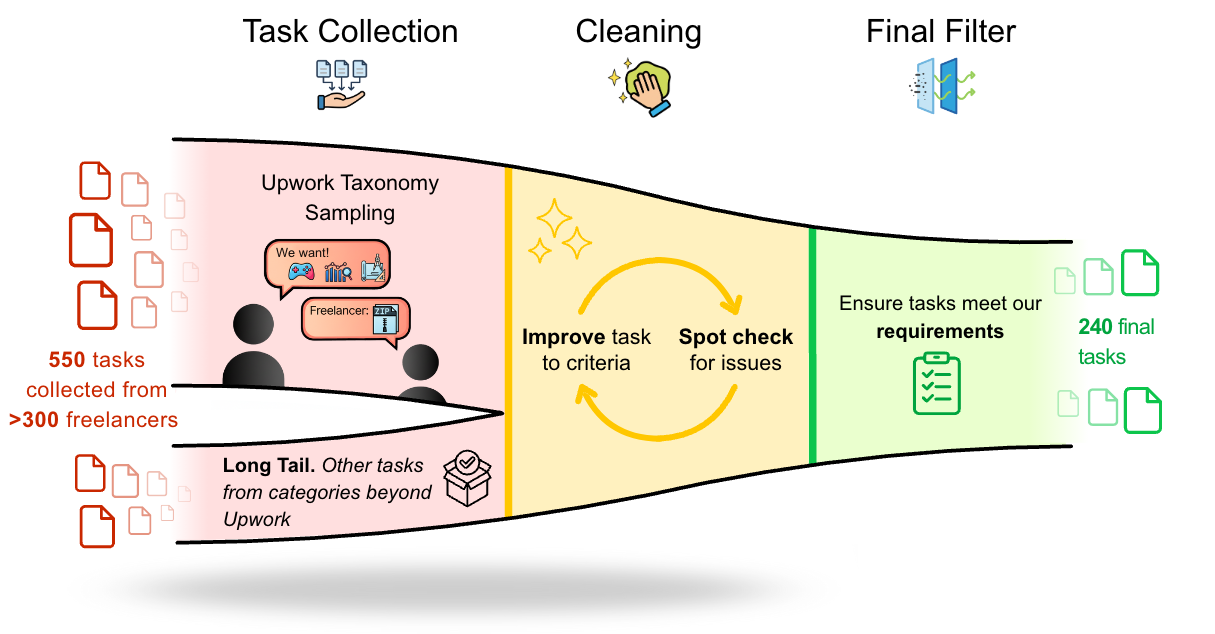
Source: A bottom-up collection from 358 verified freelancers on the Upwork platform.
Scope: 23 Upwork domains (from 64 total), excluding projects requiring physical labor, long-term evaluation, or direct client interaction.
Review & Standardization:
Filtering: 550 initial projects were filtered for completeness, reproducibility, and professional quality, resulting in 240 projects to be attempted.
Anonymization: All PII was removed or replaced with synthetic alternatives to preserve project realism.
Data Release:
Private Set: 230 projects are used for all quantitative leaderboard evaluation.
Public Set: 10 projects and the open-source evaluation platform are released for qualitative analysis.
Dataset Statistics
Total Economic Value: $143,991
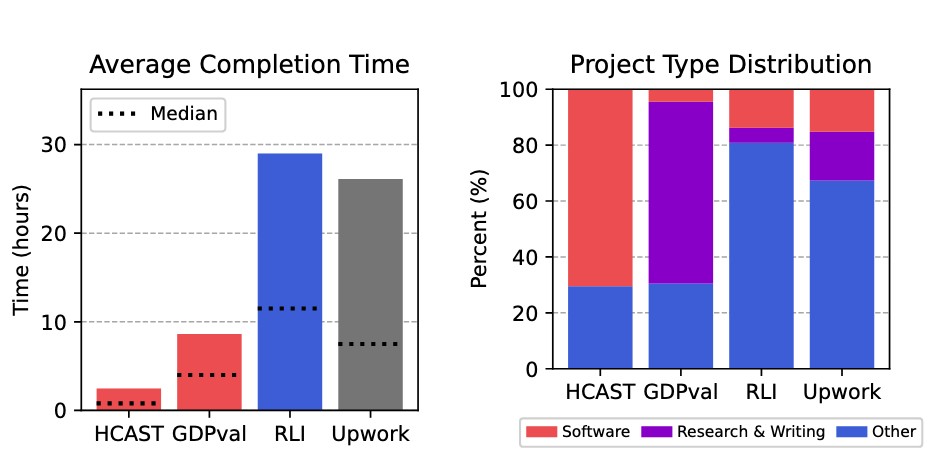
Project Difficulty & Value: RLI projects mirror the complexity of real freelance work, far exceeding previous benchmarks.
Mean Human Completion Time: 28.9 hours (Median: 11.5 hours)
Average Project Value: $632.60 (Median: $200)
Distribution of RLI Projects Includes:
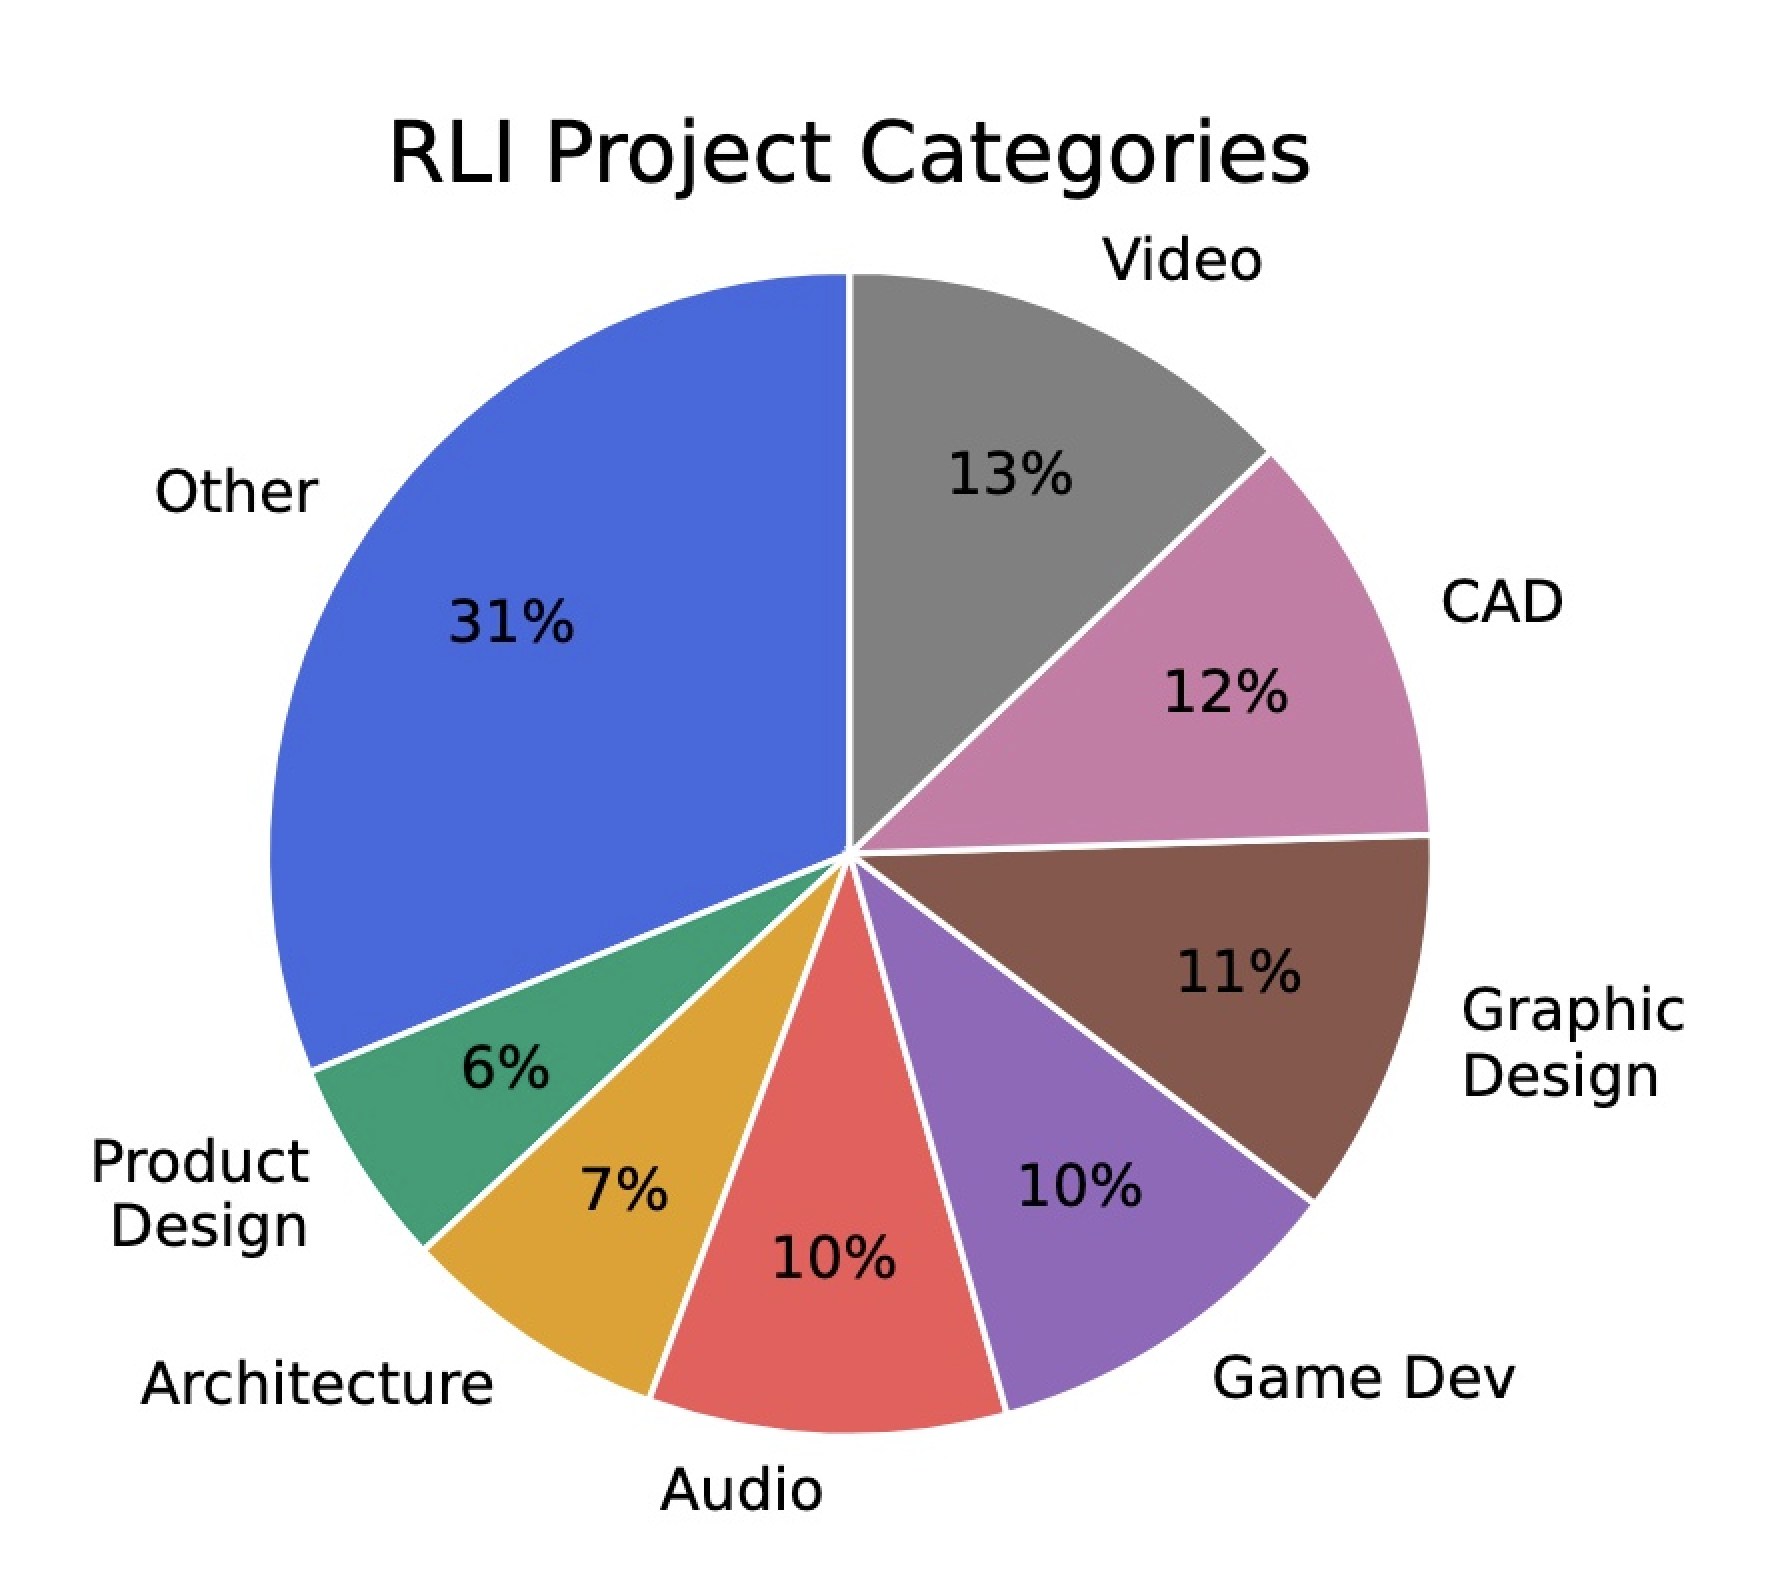
File & Modality Diversity: Projects require agents to understand and produce complex, multi-file deliverables, including dozens of unique deliverable file types. This spans documents, audio, video, 3D models, and CAD files.
Core Metrics
We use four primary metrics to evaluate agent performance on the RLI.
Automation Rate: The percentage of projects where an AI's deliverable is judged at least as good as the human standard. This is the primary success metric, defined as whether a "reasonable client" would accept the work.
Elo Score: A relative performance score from pairwise comparisons that captures granular progress in both project completion and overall quality. The human baseline is fixed at 1,000 Elo.
Dollars Earned: The total dollar value (based on the original human cost) of all projects that an agent successfully completes (i.e., meets the Automation Rate standard).
Cost Savings: The percentage reduction in cost from using an AI agent, averaged across all projects. If an agent fails a project, its cost for that project is considered infinite, resulting in a 0% cost saving.
Evaluation Methodology
Evaluating RLI's complex, multimodal deliverables is beyond current automated systems. All evaluations are therefore performed manually by trained experts using a specialized platform.
Rationale: Projects span dozens of formats (3D models, video, CAD) and require holistic, domain-expert judgment (e.g., "Is this architectural plan correct?"), which cannot be reliably automated.
Platform: An open-source, web-based evaluation platform was developed to natively render diverse deliverables (CAD files, codebases, layered design documents) for consistent inspection.
Automation Rate (Human vs. Model) Evaluation:
Procedure: A reviewer compares the AI's deliverable ("alternative") directly against the human gold standard ("reference").
Standard: The judgment is holistic: "Does the alternative satisfy the brief at least as well as the reference, such that it would be accepted by a reasonable client?"
Scoring: A 3-point scale (1: Fails, 2: Meets standard, 3: Exceeds standard). The Automation Rate is the percentage of projects scored as 2 or 3.
Elo (Model vs. Model) Evaluation:
Procedure: Reviewers conduct a pairwise comparison of two AI deliverables (AD-1 vs. AD-2), using the human deliverable as a quality reference.
Scoring: Reviewers judge on two axes: (1) closer to Project Completion and (2) higher Overall Quality. A unified preference is derived to update Elo scores.
Reliability: A 94.4% inter-annotator agreement for the Automation Rate metric is achieved using a majority vote from three independent evaluators.
Key Results & Insights
Absolute Automation is Near Zero: Current agents perform near the floor. The highest-performing agent (Manus) achieved a 2.5% automation rate, with other models performing worse. This indicates systems fail to complete the vast majority of projects to a professional, client-ready standard.
Steady Relative Improvement: While absolute performance is low, Elo scores reveal steady, measurable progress. Newer frontier models consistently rank higher than older ones, demonstrating RLI's sensitivity for tracking granular improvements long before full project automation is achieved.
Common Failure Modes: Analysis of failed projects shows failures cluster around fundamental issues:
Poor Quality (45.6%): Agents produce "child-like" or amateur-quality work (e.g., in images, code, 3D models).
Incomplete Deliverables (35.7%): Submissions include truncated videos, missing files, or partially completed work.
Technical & File Issues (17.6%): Agents produce corrupt, empty, or incorrect file formats.
Inconsistencies (14.8%): Agents fail to maintain visual or logical consistency across files (e.g., a house's design changes between different 3D views).
Pockets of Success: Successful automations were concentrated in specific creative domains, particularly audio tasks (sound effects, vocal separation), image generation (logos, ads), report writing, and data retrieval.
Agent Methodology
To generate AI deliverables, we used a standardized setup to fairly assess the peak capabilities of each agent framework, providing common tooling, prompts, and execution environments.
Models & Environments: We evaluated agents like Manus, Claude Sonnet 4.5, GPT-5, ChatGPT agent, and Gemini 2.5 Pro. Agents were tested in two environments:
CLI-based: A command-line interface (OpenHands) for tasks in code, data, and file manipulation.
Computer-Use: A GUI-based environment simulating human-computer interaction (mouse, keyboard). The leaderboard reports the single best performance for each agent, regardless of environment.
Scaffolding & Tools: All agents received a standardized prompt, the project brief, and access to specialized tools for multimedia tasks, including image generation (gpt-image-1), speech generation (openai/tts-1), and video generation (veo-3.0-generate-preview).
Evaluation Compatibility: Agents were given an "evaluation compatibility prompt" detailing all supported file formats to ensure they produced renderable outputs that our platform could review.
Generation Budgets: A maximum generation budget of $30 was set per task. This standardized for cost and ensured agents had sufficient opportunity to complete their work.
Limitations
While RLI provides a robust measure of real-world capabilities, it has several key limitations:
Evaluation Scalability: The benchmark relies entirely on rigorous manual evaluation by trained experts. This is necessary for accurately assessing complex, multimodal work but is also time-consuming and expensive, making it difficult to test new agent frameworks at high frequency.
Incomplete Project Coverage: RLI is broad but does not represent the entire digital economy. The dataset explicitly excludes projects that require direct client interaction (e.g., customer service, tutoring), physical labor, or long-term evaluation (e.g., SEO).
Benchmark Contamination Risk: As with any public benchmark, there is a risk that future models may inadvertently train on the 10 public projects. This risk is mitigated by using a private test set of 230 projects for all official leaderboard scoring.
Performance Comparison
3.75±0.00
2.50±0.00
2.50±0.00
2.50±0.00
2.08±0.00
2.08±0.00
1.67±0.00
1.25±0.00
1.25±0.00
0.83±0.00
Score measures Automation Rate. There is no confidence interval for Automation Rate.