VISTA
Introducing VISTA: A Rubric-based Visual Task Assessment
The growing capabilities of multimodal language models have created two critical challenges in their evaluation. First, as these models become more prevalent, their potential exposure to visual test data during training compromises benchmark integrity and evaluation reliability. Second, traditional evaluation approaches that focus solely on answer accuracy provide limited insight into models' visual reasoning processes, particularly when dealing with open-ended responses where simple answer normalization might prove inadequate.
Introduction
To address these challenges, we present VISTA, a novel multimodal benchmark designed to evaluate complex visual-language understanding. VISTA, short for Visual Task Assessment, tests models' abilities across both natural images and graphical content, requiring the integration of multiple perception skills - from OCR and spatial understanding to object recognition - while engaging broader reasoning capabilities in logic, calculation, and common sense. Each task is evaluated through a structured rubric of yes/no questions that decompose responses into specific testable conditions. This design, combined with the requirement that each question has challenged at least one prominent language model, ensures VISTA serves as a demanding testbed for visual reasoning capabilities.
Existing multimodal benchmarks have largely focused on specialized domains: academic knowledge (e.g., MMMU, AI2D), document understanding (e.g., DocVQA, ChartQA), or specific capabilities like mathematical reasoning (e.g., MathVista, MME). These benchmarks typically rely on multiple-choice questions or normalize free-form responses to enable systematic evaluation. In contrast, VISTA spans a broad spectrum of visual content, from natural photographs to domain-specific graphics, while requiring models to integrate multiple perception abilities in solving complex reasoning tasks. Through free-form responses and conditional evaluation, VISTA aims to reveal a deeper view of the extent of models' visual reasoning capabilities.
In the following sections, we detail VISTA's methodology and demonstrate its effectiveness in evaluating state-of-the-art models.
Dataset Description
VISTA contains 758 prompt-image pairs, comprising 747 unique images, each accompanied by an ideal response and a set of yes/no rubric questions that define the evaluation criteria. To ensure benchmark rigor, each image-prompt pair was carefully designed to challenge at least one prominent language model. The benchmark focuses on single-turn interactions with single-image tasks.
The dataset is structured along multiple dimensions. Tasks are primarily categorized by:
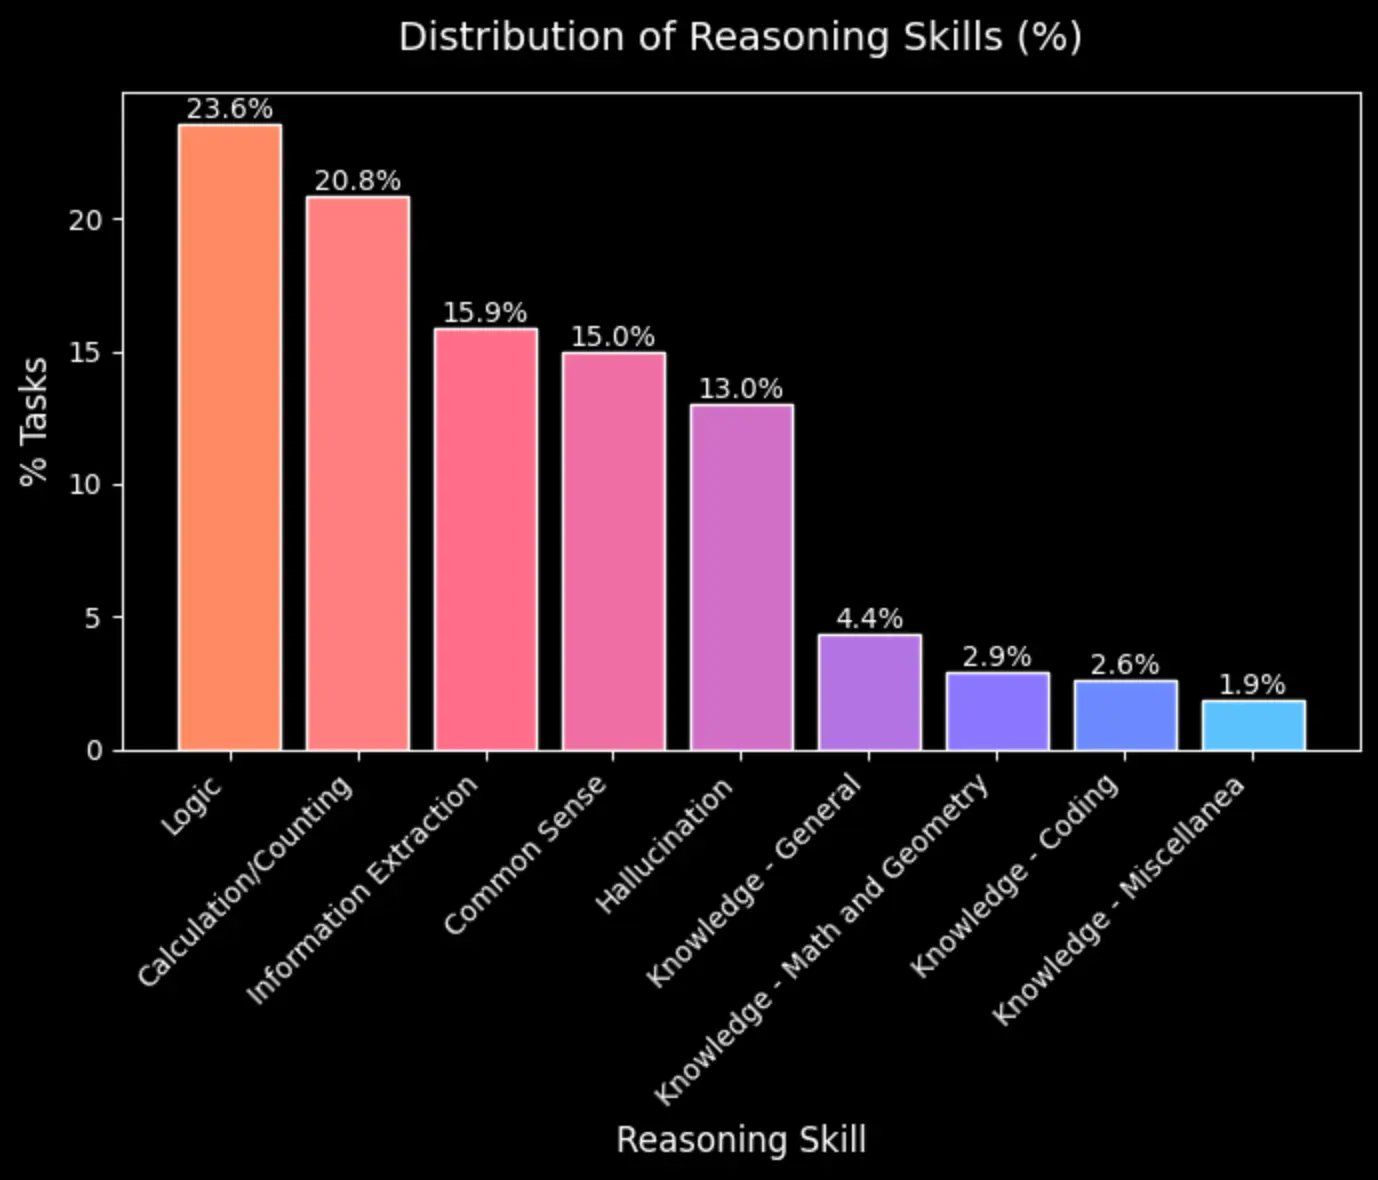
Main reasoning skill required (logic, calculation, common sense, etc.)
Image type (natural or graphic)
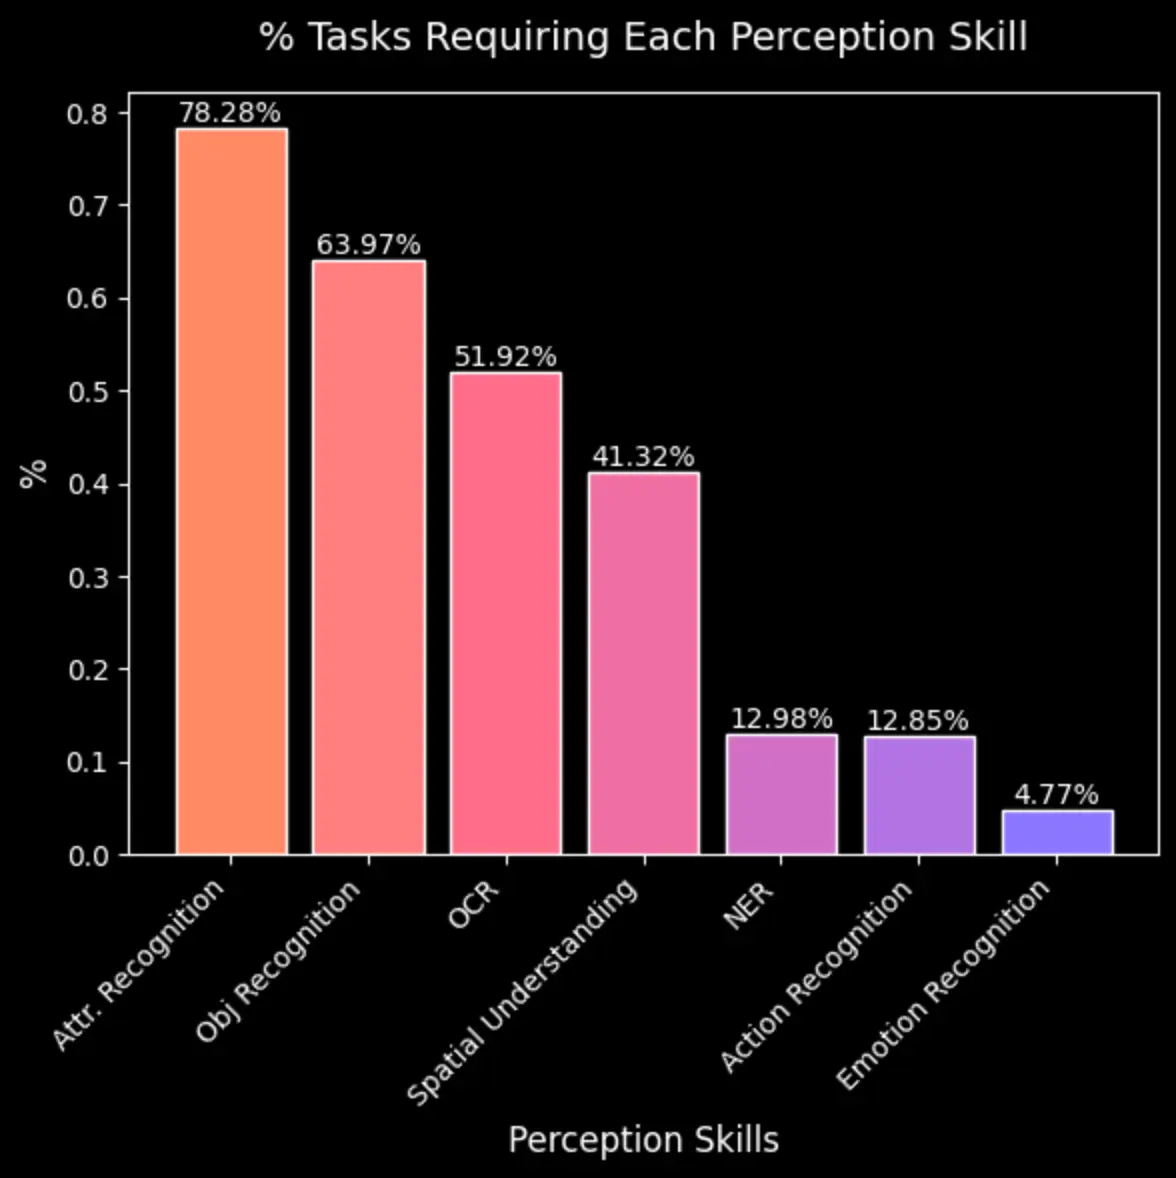
Required perception skills (OCR, spatial understanding, object recognition, etc.).
For the benchmark integrity and to assess models' generalization capabilities, Scale will keep the current dataset private until models demonstrate significant improvement.
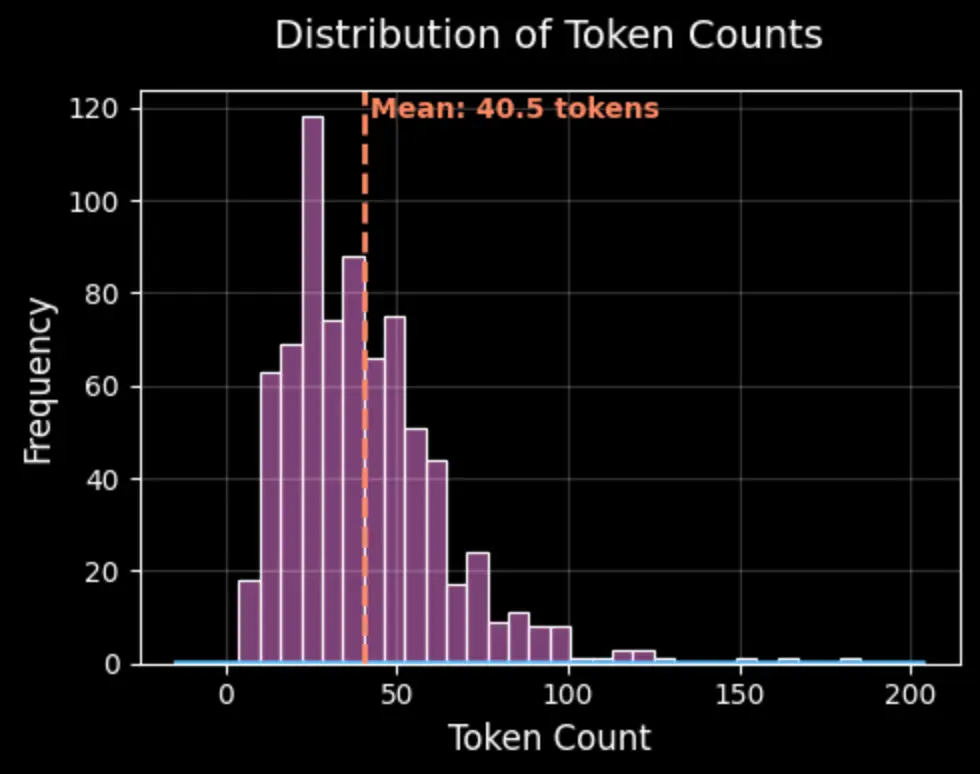
To maintain realistic conditions, we kept prompt lengths moderate. Rather than artificially extending prompts, annotators were instructed to create complexity through concise but challenging questions. This approach better reflects real-world usage patterns than lengthy, contrived prompts.
In designing the tasks, we initially created a balanced distribution of required perception skills across prompts. While annotators were given this foundation, they had the flexibility to change and incorporate additional perception skills as needed. Our analysis revealed that the most frequently required perception skills in VISTA's visual reasoning prompts are: attribute recognition, object recognition, Optical Character Recognition (OCR), and spatial understanding.
Rubric questions are a crucial component of VISTA's task design, serving to assess the accuracy of model responses. Rather than enforcing a fixed number of questions per rubric, we allowed annotators to include as many questions as necessary to evaluate response correctness. As a result, rubrics vary in length, ranging from single-question assessments to more complex evaluations containing up to seven questions.
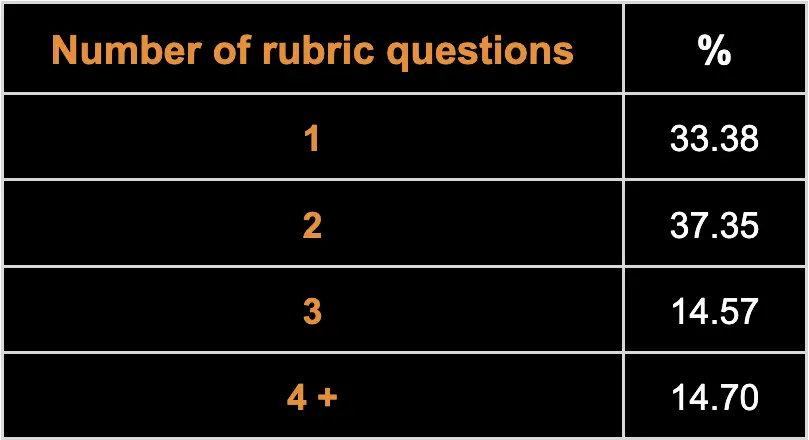
Table 1. The number of conditions that need to be satisfied to assess the correctness of a response might vary. The table reports the distribution of the number of rubric questions per task.
Data Collection
The task collection process has involved 148 contributors with Bachelors & Masters Degrees and skills in Teaching, Research, Coding, Customer Service, Data Analysis, Supervision and STEM. The dataset resulted in the collection of 1200 tasks among which a total of 758 (63%) passed the quality control checks to constitute the current evaluation set (see steps 4 and 5 of the data collection workflow).
Workflow
The VISTA dataset was created through a rigorous multi-stage process designed to ensure task quality and complexity. The pipeline consists of five major stages:
Task Assignment: Each contributor receives this specific combination of requirements (primary reasoning skill, image type, and two suggested perception skills) to guide their work in creating challenging and well-defined tasks.
Development Phase: In this phase, contributors source appropriate images and create prompts that align with their assigned parameters. To ensure task complexity, each prompt must engage at least two distinct perception skills. Two validation checks are applied to confirm both the task's challenging nature and its genuine requirement for visual understanding:
Visual Difficulty: the assigned model must fail task
Visual Requirement: the assigned model must not be able to solve the task without seeing the image
Response Documentation: Contributors provide comprehensive documentation for each task, ensuring clarity and evaluability of responses through structured answer components. This consists of an Ideal Response composed of a "Main Response" that synthesizes the final answer, and a "Reasoning" section that details the logical process leading to that conclusion.
Quality control: Our quality control process involves multiple layers of review and refinement.
Assess Correctness of Ideal Response: Initial reviewers verify both the correctness of ideal responses and prompt compliance with task requirements.
Correctness Rubrics: Following this, specialized contributors develop a set of yes/no questions (and expected response) that define specific criteria for response correctness. Specifically, these questions highlight response pieces that need to be validated to assess the correctness of a response and serve as the foundation for our evaluation methodology.
Final Auditing and Filtering: The final stage employs independent annotators for thorough quality audits, with improvements assessed and implemented by highly trained reviewers.
Through this comprehensive process, we retained a final set of 758 high-quality tasks that meet our rigorous standards. Common reasons to discard tasks have been: prompt ambiguity, rubric specificity, and response correctness.
Evaluation Methodology
Models are evaluated through a comprehensive dual-assessment approach. Each evaluation is repeated three times for statistical robustness, with results presented as averages with standard deviations.
Free-form Response Assessment: Our first evaluation approach assesses the overall correctness of model responses. Three LLM judges independently evaluate if a model's response reaches the same conclusion as the ideal response's "Main response" section. This is a boolean assessment where responses are labeled as either correct or incorrect, with final decisions made through majority voting. This jury system helps avoid potential biases or preferences toward specific models.
Metric: Accuracy [0,1]
Represents the percentage of tasks correctly answered by the model
Based on majority vote across three judges
Lower values indicate poorer performance
Rubric-based Assessment: Our second approach provides a more granular evaluation of response quality. As with the free-form assessment, we employ a jury of three LLM judges to mitigate potential biases. Each judge independently evaluates responses against specific rubric questions, with separate prompting for each question. Results are aggregated at the task level to compute a task-specific accuracy rate. The assessments of individual judges are aggregated before computing the task-specific accuracy rates.
Metric: Average Task Accuracy (ATA) [0,1]
Task Accuracy: Percentage of rubric questions satisfied per task
ATA: Average of task accuracies across all evaluation tasks
Higher values indicate better satisfaction of correctness criteria
Provides insight into partial correctness of responses
The key difference between these approaches lies in their granularity. While the free-form assessment provides a binary measure of complete correctness, the rubric-based assessment captures partial correctness through more nuanced evaluation. This granularity is particularly valuable when evaluating advanced models, as it can reveal how they not only reach correct final answers but also satisfy additional correctness criteria defined by annotators. This deeper evaluation is reflected in the leaderboards, where the rubric-based assessment typically shows smoother performance differences between models, especially among top performers who may achieve similar accuracy scores but differ in their ability to meet these additional quality requirements.
The LLMs composing the jury for both evaluation approaches are claude-3-5-sonnet-20240620, gpt-4o, and gemini-1.5-pro.
Evaluation Results
Rubric-based assessments provide a more fine-grained evaluation by breaking down task completion into multiple checkpoints. Rather than a binary right/wrong judgment, this approach can reveal when models partially succeed at complex tasks, offering a more nuanced view of model performance. For instance, a model might correctly identify key elements in an image but fail to draw accurate conclusions from them.
Free-form evaluations, conversely, mirror real-world scenarios where partial success may not be sufficient. This method sets a higher bar by requiring complete and accurate responses, similar to how users would judge model responses in practical applications.
Given these distinct perspectives, using both evaluation methods provides complementary insights into model capabilities. The rubric-based approach helps quantify partial successes, while free-form evaluation measures practical effectiveness. Together, they offer a more complete picture of current model limitations and capabilities.
Human Baseline
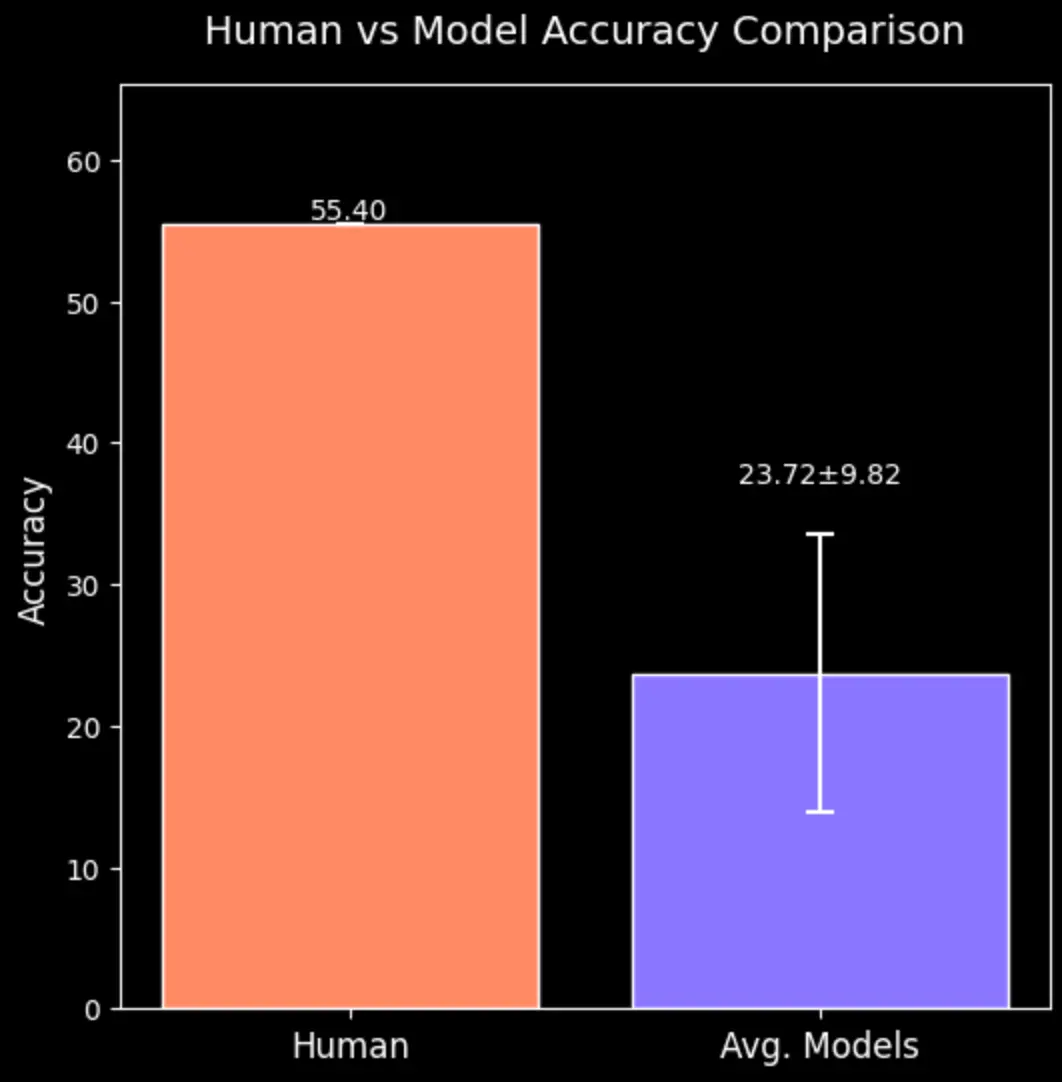
To establish a human performance baseline for VISTA, we conducted a controlled evaluation study with 16 full-time employees across 101 tasks. Each participant was given three minutes per task and had access to high-resolution images and internet resources, simulating realistic visual reasoning scenarios while maintaining consistent evaluation conditions.
To prioritize accuracy over explanation, participants were asked to provide only their final answers within the time constraint, without requiring detailed reasoning. The study revealed a human accuracy rate of 55.40% across all tasks. When compared to the average performance of models currently on the leaderboard (see Figure 8), the results expose a substantial gap between human and model capabilities in visual reasoning tasks, highlighting significant room for improvement in current systems.
We tracked two key factors during the study: whether participants felt the 3-minute time limit was sufficient and whether they used internet resources. By analyzing this feedback alongside response accuracy, we found that participants considered approximately 75% of tasks to be completable within the 3-minute window. Notably, even for tasks deemed manageable within the time limit, participants still produced a significant number of incorrect responses.
This finding is particularly interesting as it reveals that tasks considered straightforward by humans within a limited timeframe still prove challenging for current models. Table 2 breaks down response accuracy based on participants' perceived time needs:
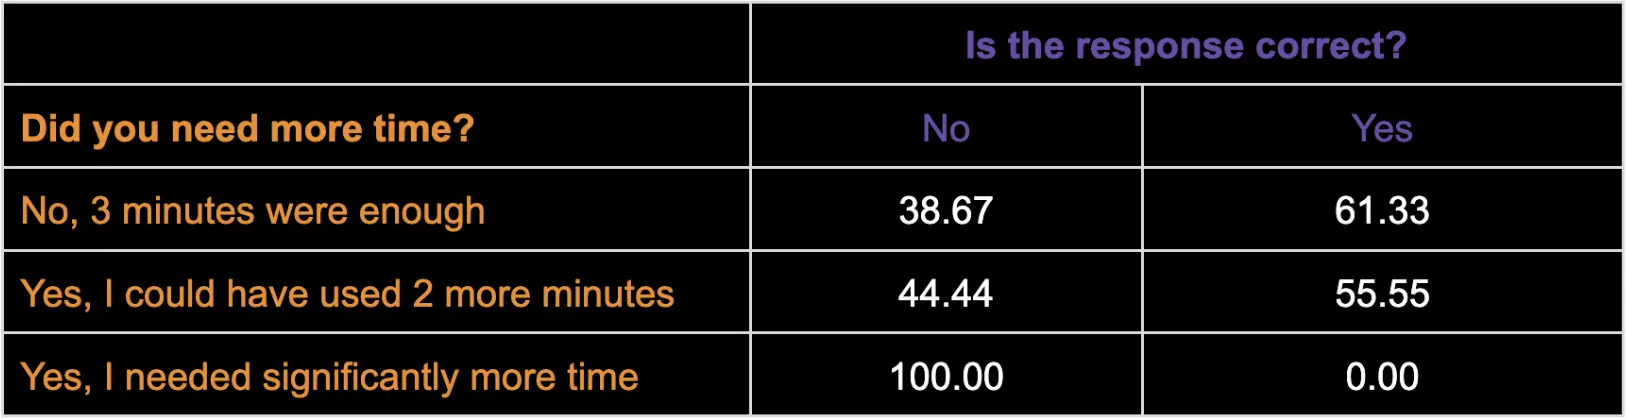
Table 2. Response accuracy percentages categorized by participants' assessed time needs for task completion.
Limitations
While Scale has invested significant effort in developing this novel rubric-based evaluation framework, we acknowledge several important limitations. The process of crafting effective rubric-based evaluations is still evolving, and the extensive training required for contributors to write precise, comprehensive rubrics represents a substantial challenge. We recognize that the current rubrics, while functional, have considerable room for improvement and enrichment.
Acknowledgments
This project was made possible by the dedicated efforts of a team of expert annotators. We extend our gratitude to everyone involved in the human studies and refinement of the dataset and the verification methodology, especially to Spencer Whitehead and Chen Xing for the initial task taxonomy definition.
Scale AI Team: Cristina Menghini, Ernesto Hernandez, Diego Mares, Dean Lee, Mike Lunati, Summer Yue
Image Type
Image Type | Description | Examples |
Natural Images | Images depicting objects or scenes from the real world. | Photographs, Paintings, Sketches, Portraits, Comics/Cartoons |
Graphics | Images presenting information visually, like charts, graphs, or technical diagrams. | Diagrams, Tables, Plots, Maps, Timelines, Infographics, Puzzle testing |
Reasoning Skills
Skill Name | Description | Examples of prompts (w/o image) |
Calculations / Counting | Prompts that test the model’s ability to perform numerical operations based on the image or count visual elements within images or scenes. | Can you provide the total revenue of films that Disney owns the right to? I'm cooking for six people and I'd like to have a half ear of corn for each person. How many more ears should I add to the grill? |
Knowledge: General, Coding, Math & Geometry, Miscellaneous (chemistry, music, biology, others) | Prompts that require specific knowledge of a topic or area in order to be correctly answered. | In the image, if the line "a = 30" was added directly in the middle of the print statements (overwriting existing code lines), what line number would it be and what would be the output for the entire code? Which three cell lines had the lowest expression using the anti CDK2 antibody? Can you explain how you interpreted this from the graph? |
Logic | Prompts that request for some logical conclusion based on the image and, potentially, some given hypotheses or logical statements. | Can you give me two puzzle words that overlap on the grid? |
Common Sense | Prompts that request information that can be reasonably inferred from the visual content but is not necessarily self-evident or even representable visually. | According to the form of the pit fire, considering how many chairs are around its half, how many extra chairs, besides the ones that already are there, could I fit around it keeping the same space between them as in the image? |
Hallucination | Prompts that request information that is not present or deducible from the image. | Is this the beginning or the end of the interview? How can you tell? In the image, identify the name of the florist shop and determine whether it is likely that they have a large inventory or a small inventory. Sum the percentages of the only candy above 15% and the only candy below 2.5% from the chart. |
Information Extraction | Prompts that request to find information in the image and re-organize it following specific formats such as lists, csv, tables, sorting, visual sorting, etc. | This is a picture of Carrigogunnell Castle in County Limerick, Ireland. There are a couple of clues in this picture that indicate if the weather is likely to be temperate. Put the clues in a bulleted list and put your conclusion in bold. Create a markdown table with headers for the teams and the number of games drawn in descending order. Do not include teams based in London. Based on this image, provide a list of the five flights with the highest flight number, in order from highest to lowest. Of those flights, what is the time difference between the earliest and latest scheduled departure? |
Perception Skills
Skill | Description |
|---|---|
OCR | Prompts that require the model to extract text from images or scanned documents. |
Object recognition | Prompts that require the model to identify and categorize objects within an image or scene. |
Attribute/relationship recognition | Prompts that require the model to identify specific characteristics (e.g., color, shape, texture) or semantic relationships (e.g., person holding a ball, dog’s paw) associated with objects in an image. |
Action recognition | Prompts that require the model to identify and categorize actions or activities of objects in the image. |
Spatial understanding | Prompts that request spatial information for objects in the image. They require a model’s understanding of the layout of objects in the scene to answer. |
Named visual entity recognition | Prompts that require the model to identify and categorize by name well-known visual elements, such as public figures, landmarks, logos, etc. |
Emotion/sentiment recognition | Prompts that require the model to identify the emotional state or sentiment of individuals in the image. |
Performance Comparison
Gemini 2.5 Pro Experimental (March 2025)
54.65±1.46
gemini-2.5-pro-preview-06-05
54.63±0.55
gpt-5-pro-2025-10-06
52.39±1.07
o4-mini (high) (April 2025)
51.79±0.63
o4-mini (medium) (April 2025)
51.66±1.08
o3 Pro (high) (June 2025)
51.63±0.25
gemini-3-pro-preview
51.49±0.79
Gemini 2.5 Pro Preview (May 06 2025)
50.78±0.57
gpt-5-mini-2025-08-07
50.39±2.28
o3 (high) (April 2025)
50.07±1.14
gpt-5-2025-08-07
49.69±1.03
o3 (medium) (April 2025)
49.59±0.66
claude-sonnet-4-5-20250929-thinking
48.75±1.67
Gemini 2.5 Flash Preview (May 2025)
49.15±0.36
o1 Pro (March 2025)
47.32±1.78
Claude 3.7 Sonnet Thinking (Feb 2025)
48.23±0.70
claude-opus-4-1-20250805-thinking
48.44±0.43
gpt-5.2-2025-12-11
46.62±2.23
Gemini 2.5 Flash (April 2025)
46.97±1.29
Claude Opus 4 (Thinking)
46.96±0.95
claude-opus-4-5-20251101-thinking
46.43±0.03
Gemini 2.0 Flash Thinking Experimental
45.50±1.20
claude-opus-4-6-thinking-max
46.07±0.26
GPT-4.1
45.34±0.91
kimi-k2.5
41.86±4.23
claude-opus-4-6 (Non-Thinking)
45.48±0.44
claude-opus-4-1-20250805
45.25±0.66
Claude Sonnet 4 (Thinking)
45.49±0.21
o1 (December 2024)
45.25±0.40
claude-opus-4-5-20251101
45.32±0.03
claude-sonnet-4-5-20250929
45.00±0.12
gpt-5.1-thinking
43.82±1.35
Claude Opus 4
43.53±1.24
Gemini 2.0 Pro Experimental (Feb 2025)
43.25±1.26
Claude Sonnet 4
43.21±0.52
Claude 3.7 Sonnet (February 2025)
43.02±1.14
GPT-4.5 Preview (February 2025)
42.11±1.39
GPT-4.1 mini
41.14±0.58
Gemini 2.0 Flash Experimental
39.95±0.80
Gemini 2.0 Flash (February 2025)
39.85±0.71
Claude 3.5 Sonnet (October 2024)
38.72±0.51
Claude 3.5 Sonnet (June 2024)
38.37±0.70
Llama 4 Maverick
38.33±0.55
ChatGPT-4o-latest (November 2024)
37.99±0.48
Gemini 1.5 Pro
37.07±1.34
gpt-5.1-instant
34.87±1.73
GPT-4o (August 2024)
34.94±0.23
Mistral Medium 3
34.59±1.12
Gemini 1.5 Flash 002
34.03±1.41
Pixtral Large (November 2024)
33.89±0.69
Gemini 2.0 Flash Lite Preview
32.69±1.40
Qwen2-VL-72B-Instruct
28.56±1.37
Claude 3 Opus
27.82±0.55
GPT-4.1 nano
26.55±0.35
Nova Pro
26.27±0.61
Pixtral 12B (September 2024)
25.97±0.74
Nova Lite
25.50±0.77
Llama 3.2 90B Vision Instruct
24.61±0.80
Llama 3.2 11B Vision-Instruct
20.47±0.15
Phi 3.5 Vision-Instruct
15.18±0.81
Rank (UB): 1 + the number of models whose lower CI bound exceeds this model’s upper CI bound.