SWE Atlas - Codebase QnA
Overview
SWE-Atlas is a benchmark for evaluating AI coding agents across a spectrum of professional software engineering tasks. Rather than measuring a single skill in isolation, SWE-Atlas consists of three leaderboards that target distinct and complementary capabilities:
Codebase QnA - Understand complex codebases through runtime analysis and multi-file reasoning
Test Writing - Write meaningful tests that exercise real functionality to increase code coverage
Refactoring - Restructure code to improve readability & maintainability while preserving behavior
We are releasing results for Codebase QnA, the first benchmark in the SWE-Atlas suite, with additional results for Test Writing and Refactoring to come.
Codebase QnA
Codebase QnA consists of 124 tasks that targets the upstream capability of Software Engineering - deep code comprehension that precedes any code change.
The agent is given access to a well-known, public repository inside a Docker container and must answer a deeply technical set of questions about how the system works. Questions require Agentic Reasoning by design - they require running the software, tracing execution across multiple files, and synthesizing findings. Simple codebase exploration is insufficient to solve these.
The benchmark consists of tasks drawn from 11 production repositories across 4 programming languages – Go, Python, C, and TypeScript. Top models achieve a 30% pass rate (at the strictest rubric threshold of 1.0), indicating substantial room for improvement.
See the full dataset here.
Methodology
Each QA task is constructed through a multi-stage human-in-the-loop pipeline.
Repository Selection. Repositories are selected from SWE-Bench Pro, and represent real-world software complexity: mail servers, terminal emulators, object storage systems, observability platforms, secret scanners, etc. These are large, actively maintained open-source codebases with non-trivial architectures. They are also contamination-resistant, using strong copyleft licenses (e.g., GPL).
Environment Construction. For each repository, engineers build a reproducible Docker image pinned to a specific commit, with all dependencies pre-installed, such that the software can be built, run, and tested.
Question Authoring. Professional software engineers and technical experts with significant coding and agentic experience write problem statements that require multi-step reasoning across the codebase. Experts first spend significant time familiarizing themselves with each repository's functionality, implementation, and edge cases before authoring questions. Questions are written in natural language and intentionally underspecified to challenge agents' autonomous exploration capabilities.
We emphasize that task prompts be written in natural language to emulate how they interact with coding agents like Claude Code or Cursor, and are, by nature, underspecified. Agents would need to autonomously explore the codebase, set up the application, run it with real data, understand the flow and prepare a detailed response.
Tasks fall into the following categories (Example prompts shortened for visual clarity):
Architecture & system design (35%): Questions about how a system's components are structured and how they interact.
Example: "When maddy is configured with a small max_tries and pointed at a non-responsive SMTP destination that times out, what exact sequence of connection attempts occurs? How long does each timeout take, and what log entries mark each retry attempt versus the final bounce decision?"
Root-cause analysis (30%): Questions that present confusing or seemingly broken behavior and ask the agent to determine why.
Example: "I'm sending probes to different gateways with Scapy's sr1, but responses from one gateway get matched to probes sent to another. I've verified with tcpdump that the packets on the wire are correct - so why is Scapy pairing them wrong?”
Code Onboarding (23%): Questions a new engineer would ask when getting oriented in an unfamiliar codebase.
Example: "I am joining a team that relies heavily on Scapy for custom packet manipulation and I need to understand what the runtime environment actually looks like. When you construct a basic ICMP ping packet, what's the actual structure of that packet object? I'm trying to understand whether Scapy creates a single composite object or something else - what layer types are involved, and how are they related?”
Security (9%): Questions about security properties, attack surfaces, or vulnerability patterns.
Example: "If someone submits a TruffleHog detector configuration pointing to an internal address or a cloud metadata endpoint, what security boundaries actually exist?"
API & library integration (3%): Questions about how to use a library's interfaces and understand their runtime behavior.
Example: "If I create an IP/TCP packet without setting checksums and call bytes(), then tweak a payload byte and call bytes() again - do I get fresh checksums, or does Scapy hand back the same cached bytes from before?"
We illustrate an example task below from the grafana/k6 repository from the Root-cause analysis category:
I'm debugging some strange HTTP timing metrics in my k6 load test that I think might be a measurement bug or race condition. When I make multiple sequential requests to the same endpoint, the first request shows reasonable values for connecting time and TLS handshaking, but subsequent requests show exactly 0 for both of these metrics even though I can see network activity happening. What's weirder is that sometimes the "blocked" timing shows massive values like 500ms when other times it's near zero for identical requests.
I also noticed that on one of our Windows test machines,occasionally ALL the timing metrics return 0 for random requests, which definitely seems like a race in the measurement code. The strangest part is when I look at the internal tracer state, sometimes a connection is flagged as "not reused" but the connect timestamps show the same value as the got connection timestamp, which should be impossible if a real TCP handshake occurred. I printed the tracer hook calls and saw that ConnectStart and ConnectDone sometimes get called multiple times for a single request, which looks like a double counting bug.
At this point I'm not sure if the whole HTTP tracer component is fundamentally broken or if I'm just misunderstanding something. I need to know if I can trust these timing values at all for my performance analysis, or if I should report some of these issues upstream. Adding investigation scripts are fine but remove them after you're done.
Rubric Construction. For each question, human experts define a structured rubric of evaluation criteria (average: 12.3 per task). Each criterion is a specific, verifiable factual claim that a correct answer must contain. Rubrics follow standard design principles: specific (with no or little room for interpretation), atomic (testing one distinct aspect), self-containment (gradable without external knowledge).
Here is a a subset of rubrics for the prompt shared above:
- Explains that zero connecting/TLS time on subsequent requests indicates connection reuse (connection pooling, no handshake needed for reused connections)
- Explains that variable "blocked" timing reflects connection pool wait time (waiting for available connection, pool contention)
- States that the Windows issue is not a race condition that needs fixing (OS timer limitation causes identical timestamps)
- Explains that multiple ConnectStart/ConnectDone calls are due to dual-stack/Happy Eyeballs dialing (IPv4/IPv6 simultaneous connection attempts)
- Explains that the Reused=false with matching timestamps scenario is a documented Go stdlib HTTP/2 quirk (abandoned connections get pooled and reused)
Quality Assurance. Tasks undergo a rigorous multi-stage pipeline to ensure high-quality. Throughout the process, experts are supplemented with LLM based agentic evaluators that monitor data quality in the same task environment that the expert is working in. Each task is then human-reviewed twice further in the pipeline and by Scale’s quality assurance team.
Post-creation, all tasks undergo a human consensus review of their rubrics. Three experts review each rubric, and flag rubric items that inaccurately evaluate the question's requirements or are over prescriptive. We only retain rubrics that are voted to keep by a majority of experts. After that, tasks are manually re-reviewed and those with insufficient evaluation coverage are filtered out.
Eval Metric: Task Resolve Rate
During evaluation, the agent operates inside a sandboxed Docker container with the target repository mounted. The agent has access to standard shell tools (bash, grep, find, etc.) and can build and run the software. The agent explores the repository, runs experiments, and produces a final answer.
Evaluation is performed by an LLM judge (Claude Opus 4.5) that scores the agent's answer against each rubric criterion independently. Each criterion receives a binary score (met or not met) and is then aggregated.
The primary metric is the Task Resolve Rate: the percentage of tasks for which the agent's answer is comprehensive (i.e. passes all rubric items and scores 1.0), as graded by a set of task-specific rubrics.
Agents are instructed to avoid modifying source code files and to clean up any temporary scripts created. A programmatic check automatically fails any task that contains code changes.
Results
We ran a suite of frontier closed and open coding models on the dataset, under a 250 turn limit using the SWE-Agent harness running in a sandboxed container on Modal spun up through SWE-Rex, with the standard set of tools to search, view/edit files and run bash commands. We observe that even the most frontier models (that report >80% on SWE-Bench) score <30% on the benchmark, highlighting the challenging nature of these tasks and the gap in capability in cdeeply understanding the codebase. GPT-5.2 High and Claude Opus 4.6 top the leaderboard, while GLM-5 was the leading Open Model on the benchmark.
We also evaluated Opus 4.6, GPT-5.3 Codex and GPT 5.2 high on their native custom scaffolds (Claude Code and Codex CLI) using Harbor. We observed improved performance on native scaffolds for models like GPT-5.3 codex and Opus 4.6, indicating that frontier coding models are most effective when used in combination with the tools they are trained on.
Since these tasks are specifically designed to be agentic and runtime-dependent, the ability to use tools and run commands is an essential skill. When we restrict the models from running commands and only allow it to search and view files, the performance drops significantly.
Model | Agentic coding setting (full tools) | Non-agentic setting (search/view only, no bash) |
|---|---|---|
GPT-5.2 Codex | 29.03% | 17.7% (↓40%) |
Claude Opus 4.6 | 29.03% | 16.1% (↓45%) |
Beyond the raw resolve rate, we see several interesting patterns in the behavior of frontier models.
.png)
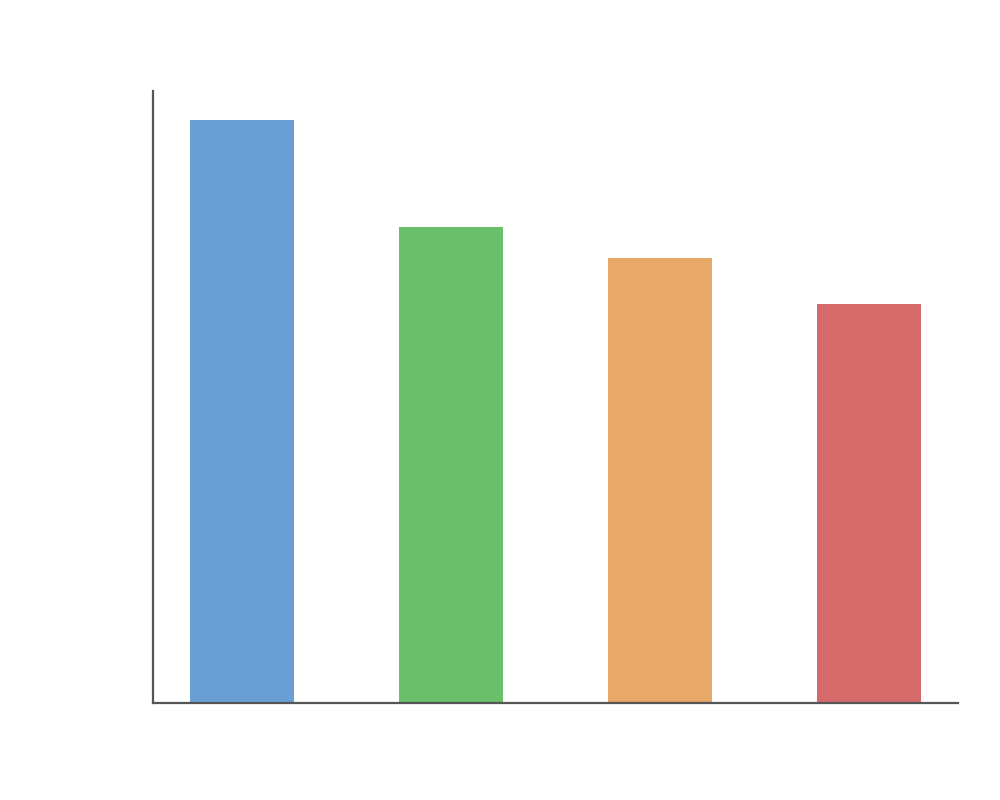
The top 3 models have a much longer solution trajectory, with the top model GPT-5.2 high taking over 120 steps on average to thoroughly explore the codebase.
Top models consistently produce longer answers (>6000 answers). There is a correlation between a model’s answer length and its resolve rate.
However, such lengthy answers are not necessary to achieve a high score. The average length of our expert authored answers are shorter than every model’s average response length. This shows that there is room to improve response length efficiency without sacrificing performance.
Codebase Exploration
.png)
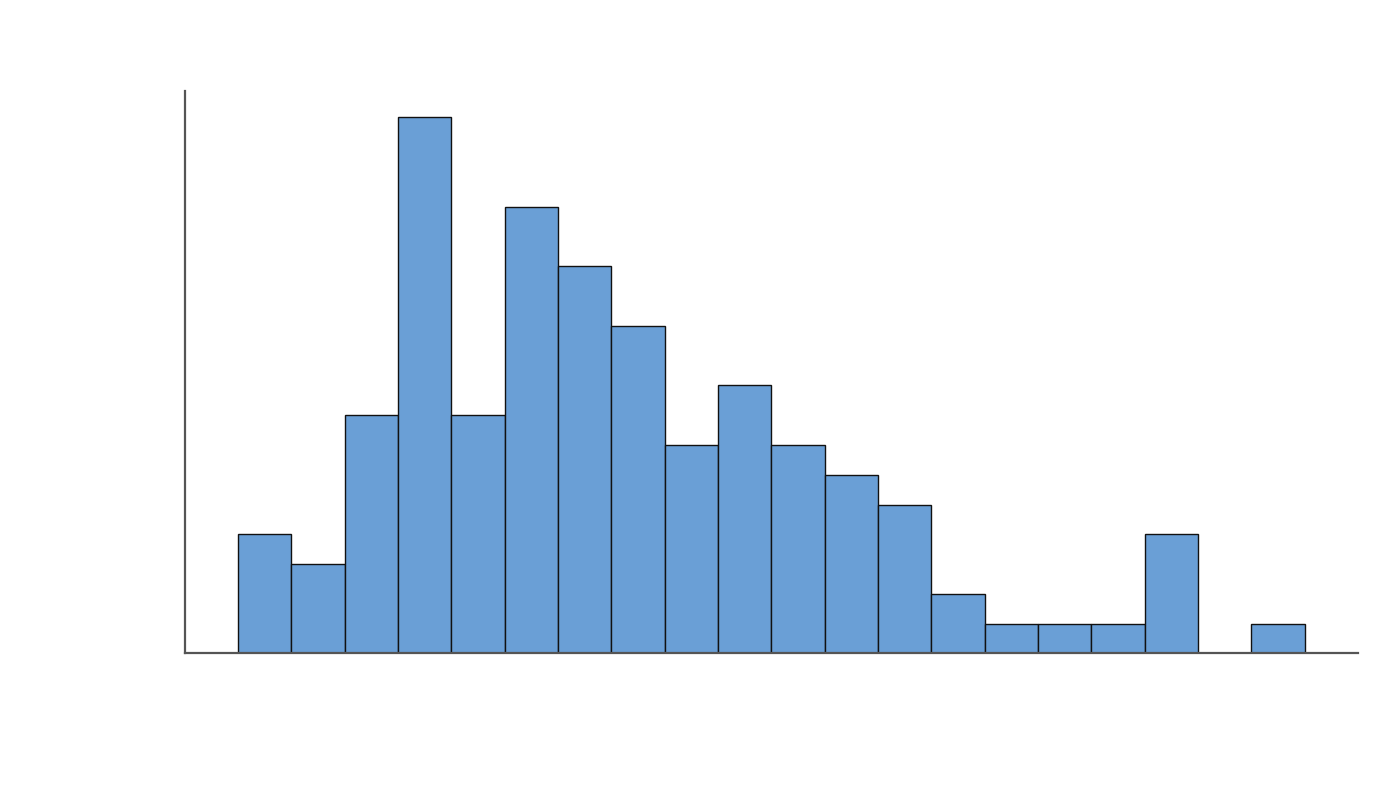
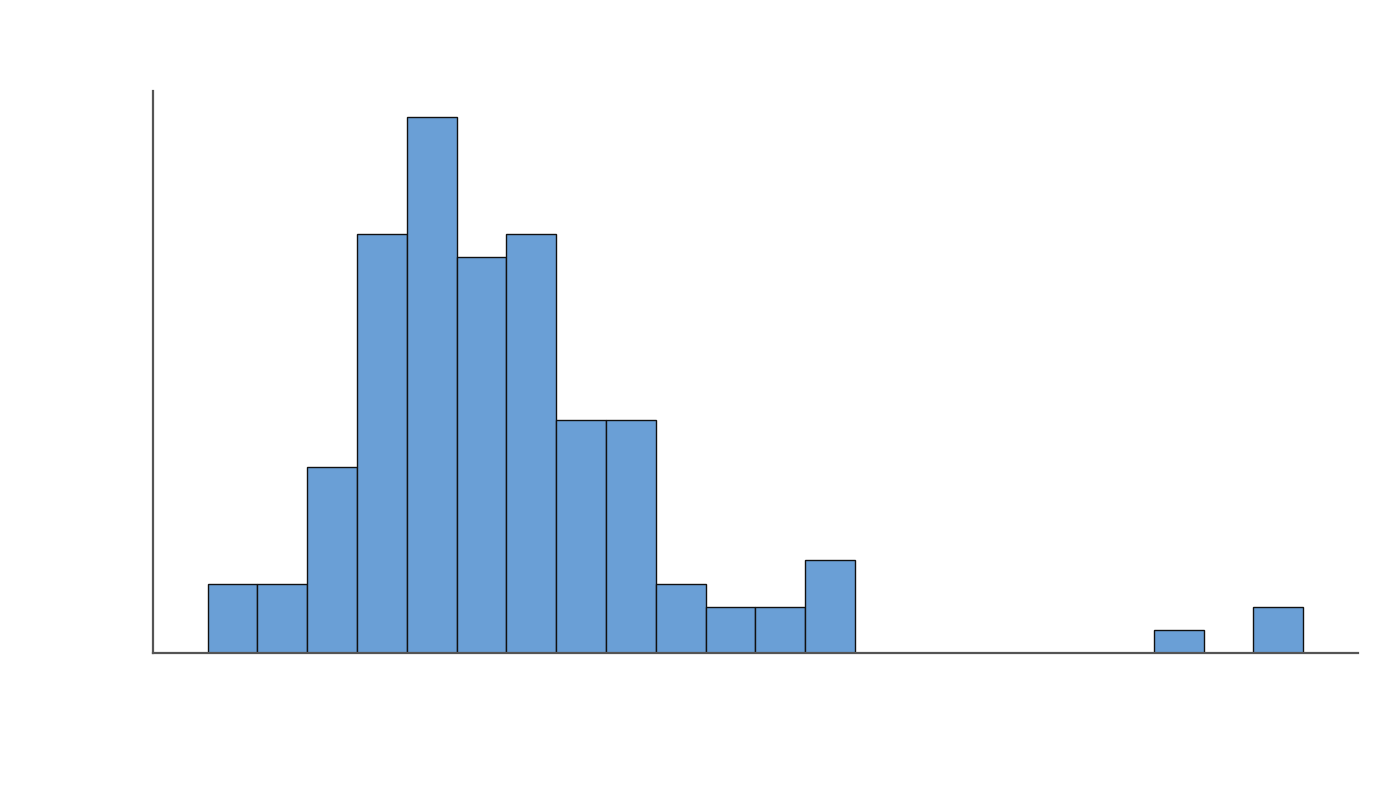
GPT-5.2 Codex (and GPT-5.2 high reasoning) searches and explores the codebase aggressively, performing more than twice the number of search operations, file reads and code executions as compared to Opus-4.6.
Failure Modes
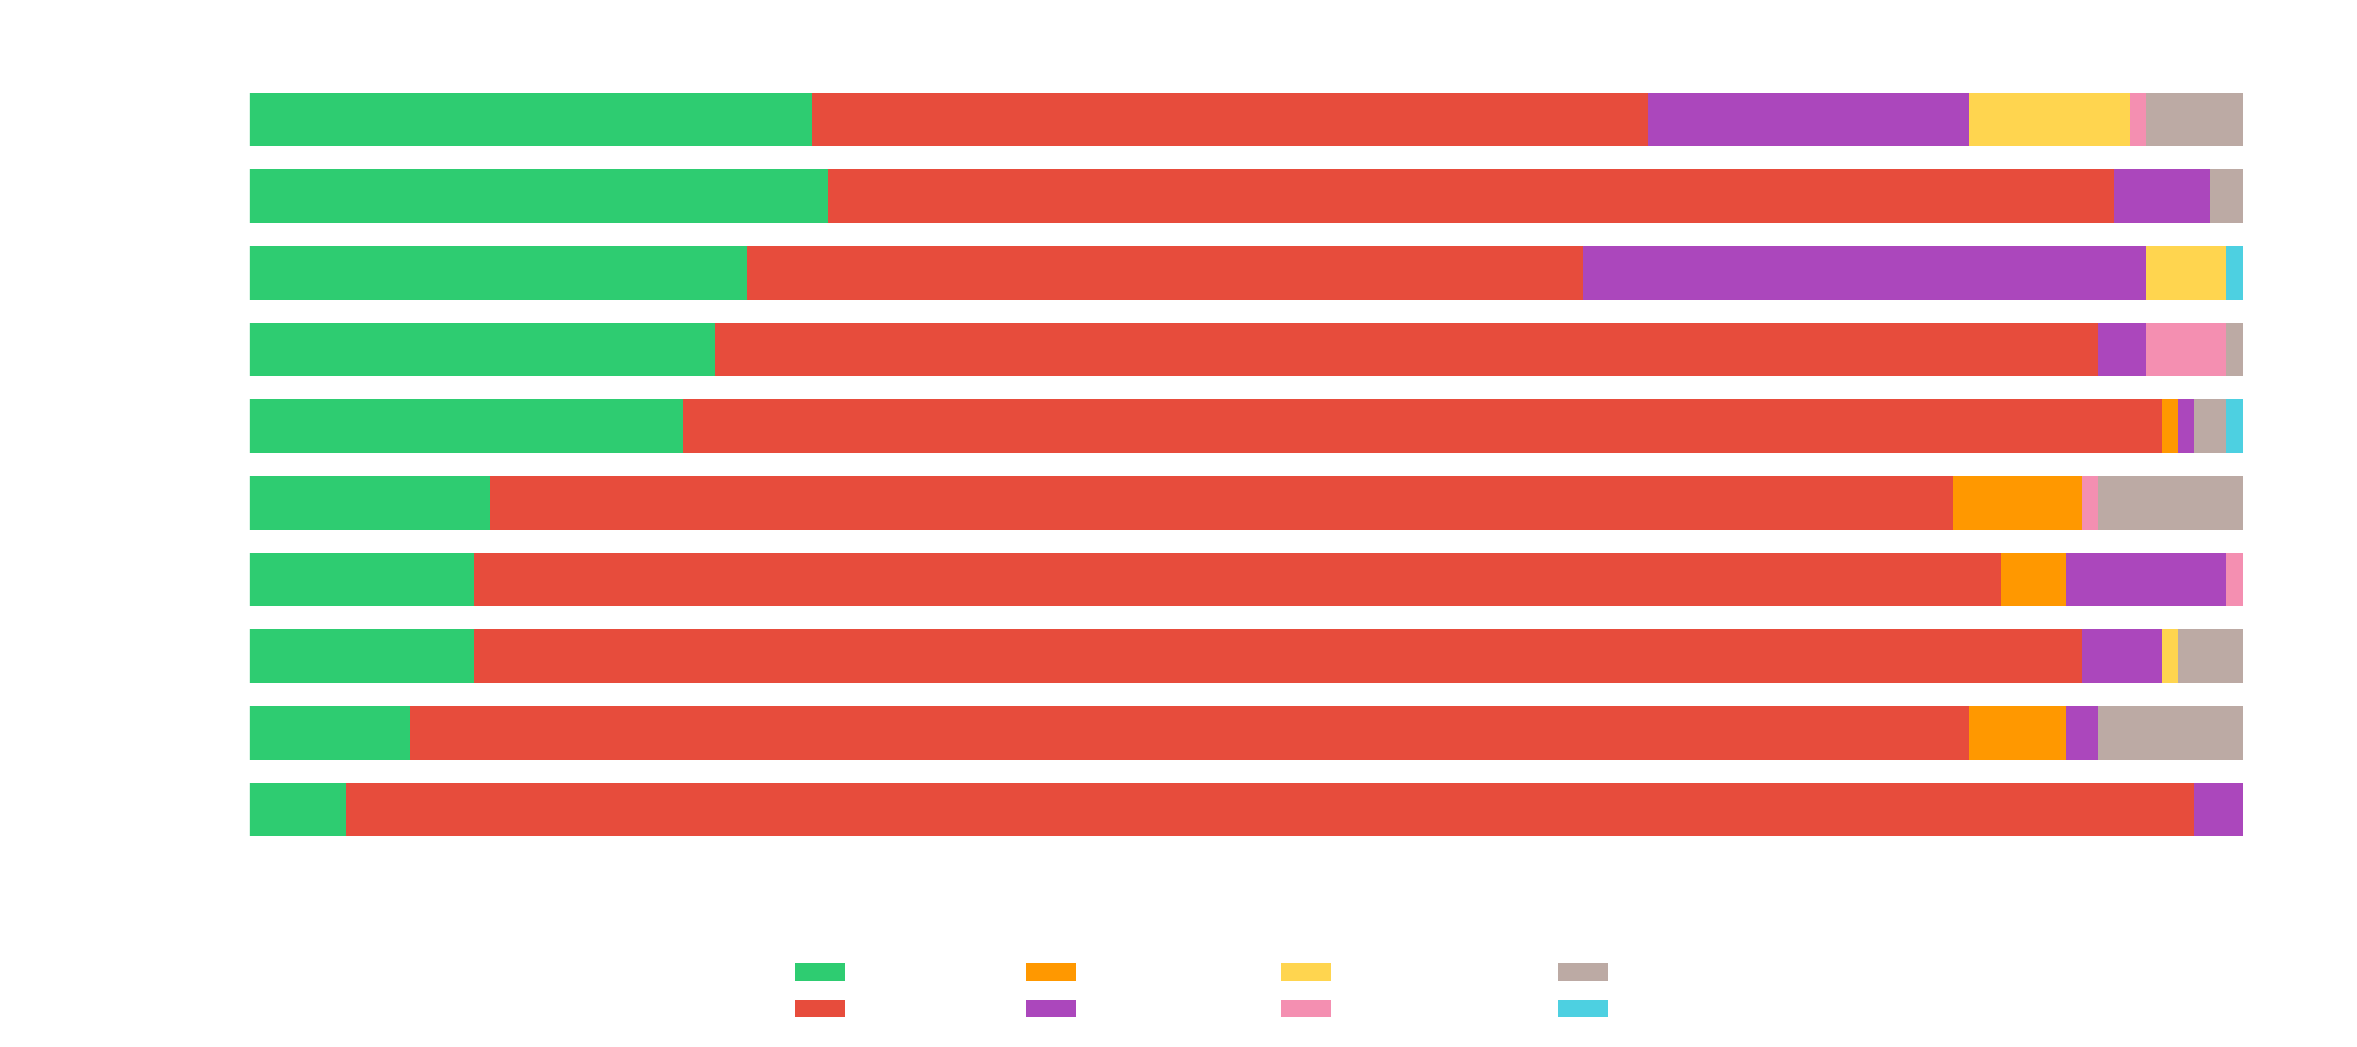
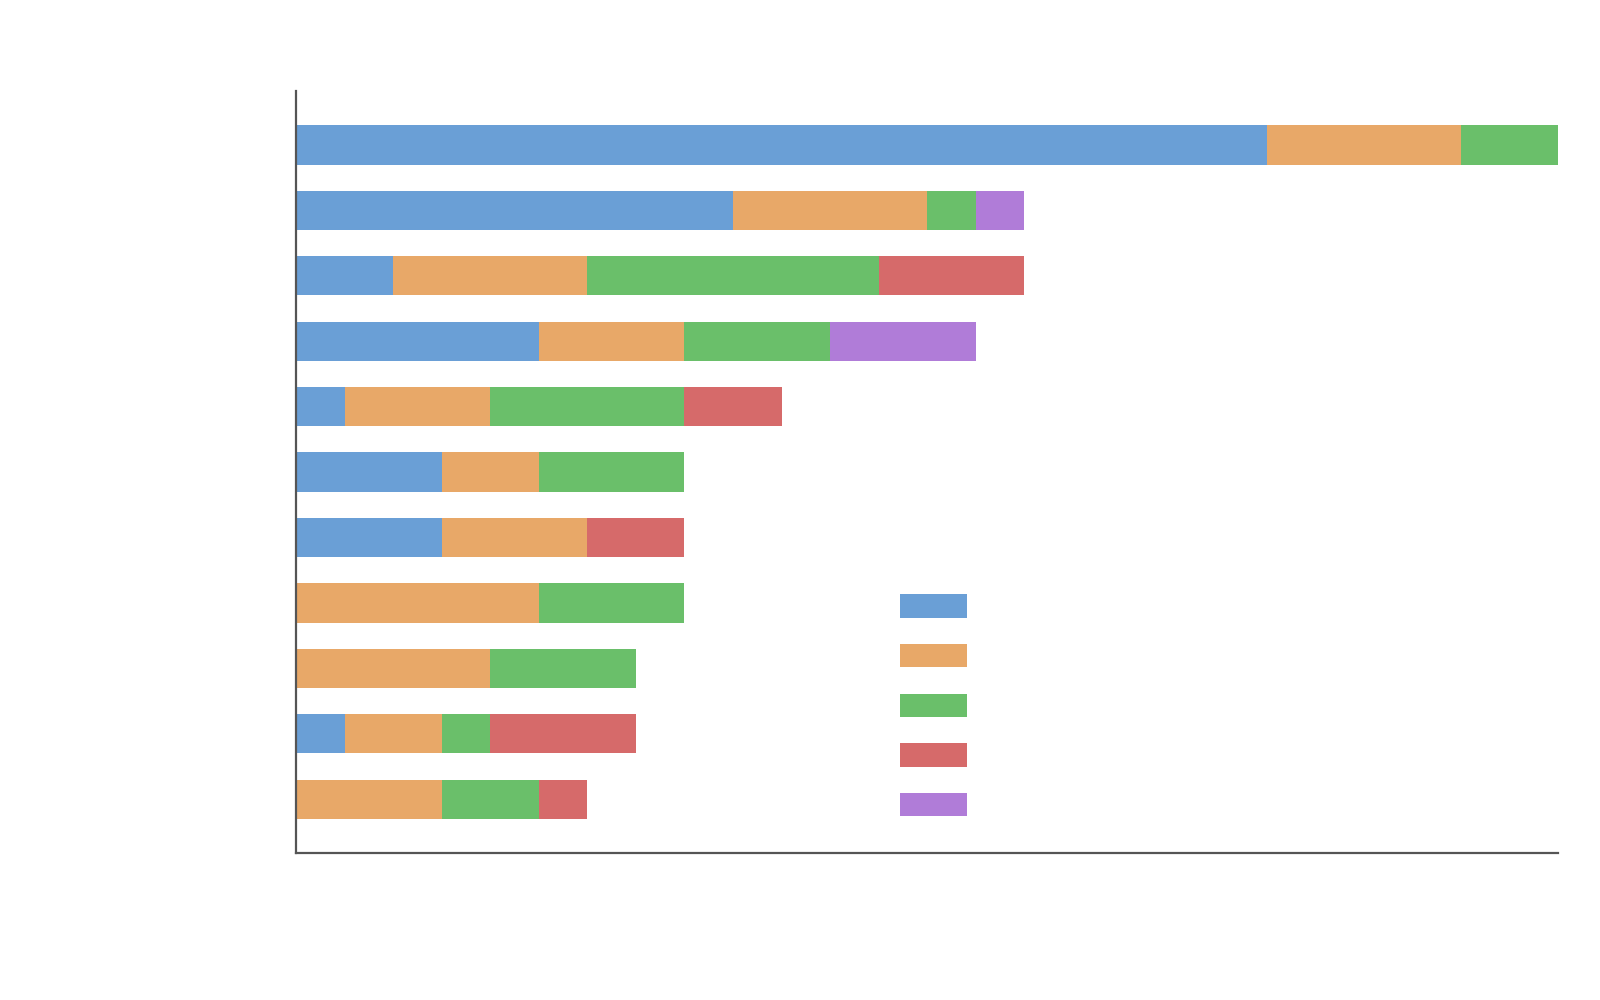
We then analyzed the outcomes of all trajectories per model to understand the failure modes. Error modes include Command Error (Agent issues complex chained multiple commands that crashed the shell/sandbox), Turn Limit (Exceeded 250 turn limit), Format Error (Repeated mistakes in calling tools), Cmd Timeout (Repeatedly issue commands that exceeds 1800 seconds to run) and Context Limit Exceeded.
We see that most models are capable agents, with <15% of the trajectories ending without an answer (turn limit exceeded, repeated format error, context limit, etc).
On a manual review of the Command Errors, we observed that:
In some long sessions (180+ steps) the agent's shell session becomes unstable, and reflects a limitation of the harness's single-session shell management, not the agent or the environment. A session recovery mechanism would likely prevent some of these.
Agents issue commands that exceed reasonably set boundaries. Ex commands from Codex:
Download + compile Go from source: curl -fsSL https://go.dev/dl/go1.23.1.linux-amd64.tar.gz ... && go build
Spin up PostgreSQL: initdb -D $PGDATA ... && pg_ctl start ... && psql
Build Go binaries: go build -o /tmp/sftpgo_audit_bin .
These issues primarily affected GPT-5.2-high and GPT-5.3 Codex.
Model Settings
Model name | Thinking settings | Temperature | Max input tokens |
|---|---|---|---|
Claude Sonnet 4.5 | High | 1.0 | 1,000,000 |
Claude Opus 4.6 | High | 1.0 | 1,000,000 |
GPT-5.2 (High) | High | 1.0 | 400,000 |
GPT-5.3 Codex | xHigh | 1.0 | 400,000 |
Gemini 3.1 Pro (Preview) | High | 1.0 | 1,000,000 |
Gemini 3 Flash (Preview) | High | 1.0 | 1,000,000 |
Qwen3 Coder 480B A35B | Default (High) | 0.7 | 256,000 |
MiniMax M2.5 | Default (High) | 1.0 | 200,000 |
Kimi K2.5 | Default (High) | 1.0 | 200,000 |
GLM-5 | Default (High) | 0.7 | 128,000 |
Performance Comparison
claude-opus-4.6 Thinking (Claude Code Harness)^
31.50±8.62
gpt-5.2-2025-12-11 (High) (SWE-Agent)
29.03±8.53
claude-opus-4-6 Thinking (SWE-Agent)
29.03±8.53
gpt-5.3-codex (xHigh) (Codex CLI)^
27.40±8.48
gpt-5.2-2025-12-11 (High) (Codex CLI)^
27.40±8.48
gpt-5.3-codex (xHigh) (SWE-Agent)
25.00±8.29
claude-sonnet-4-5 (SWE-Agent)
23.39±8.18
gpt-5.2-codex (SWE-Agent)
21.77±8.06
glm-5 (SWE-Agent)
21.77±8.06
gemini-3.1-pro-preview* (SWE-Agent)
12.10±6.90
kimi-k2.5 (SWE-Agent)
11.29±6.77
minimax-m2.5 (SWE-Agent)
11.29±6.77
gemini-3-flash-preview*
8.06±6.15
Qwen3-Coder-480B-A35B-Instruct
4.84±5.32
Rank (UB): 1 + the number of models whose lower CI bound exceeds this model’s upper CI bound.
^ These models were additionally evaluated using the model’s native scaffolds using Harbor.
* These models use a slightly different tool bundles (registry, defaults, search, edit_replace, submit) instead of the standard SWE-Agent tools used by all other models (registry, edit_anthropic, review_on_submit_m) because we observed significant performance degradations with the latter. In addition, Gemini API was given a 900s timeout instead of 300 because of issues in API stability leading to failed runs.