Coding
Introduction
The Scale Coding Evaluation consists of 1,000 prompts covering various programming languages, fields, and tasks. This comprehensive dataset spans a wide range of software engineering challenges, including debugging, code optimization, documentation creation, and analysis of complex codebases.
While the general use and understanding of LLMs’ usage for coding applications has grown, there are limited tools or benchmarks available to compare different models. The most well-known benchmarks include:
HumanEval Dataset: 164 handcrafted programming problems testing language comprehension, algorithms, and simple mathematics.
Pass@k Metric: Assesses the likelihood that at least one of the top k generated code samples for a problem passes unit tests, evaluating functional correctness.
MBPP: The Mostly Basic Programming Problems (MBPP) dataset contains 974 programming tasks, designed to be solvable by entry-level programmers, and is designed to measure the ability of LLMs to synthesize short Python programs from natural language descriptions.
SWE-Bench (Software Engineering Benchmark):Tests LLMs' capability to address real-world issues sourced from GitHub issues and pull requests.
LiveCodeBench: A collection of programming puzzles from recent competitive coding competitions designed to benchmark advanced reasoning skills while mitigating effects of data contamination.
While these evaluation benchmarks were useful when they first came out, as models started to overfit them, their application has become less valuable. Multiple coding models fine tuned from GPT-4 pre-trained models are scoring above 85 on the Pass@1 metric. Additionally, the methodology via which these models are evaluated against these benchmarks are often non-standardized, lacking a core requirement for comparing scores across tests or over time.
The goal of the Scale AI coding evaluation is to establish a uniform framework for evaluating LLMs’ coding capabilities.
Prompts Dataset Description
The Scale Coding Evaluation provides a standardized assessment framework for LLMs, enabling comparisons across models and identifying their strengths and weaknesses. It currently encompasses a set of use cases across the most requested coding languages.
Use Case | Definition | # of prompts |
|---|---|---|
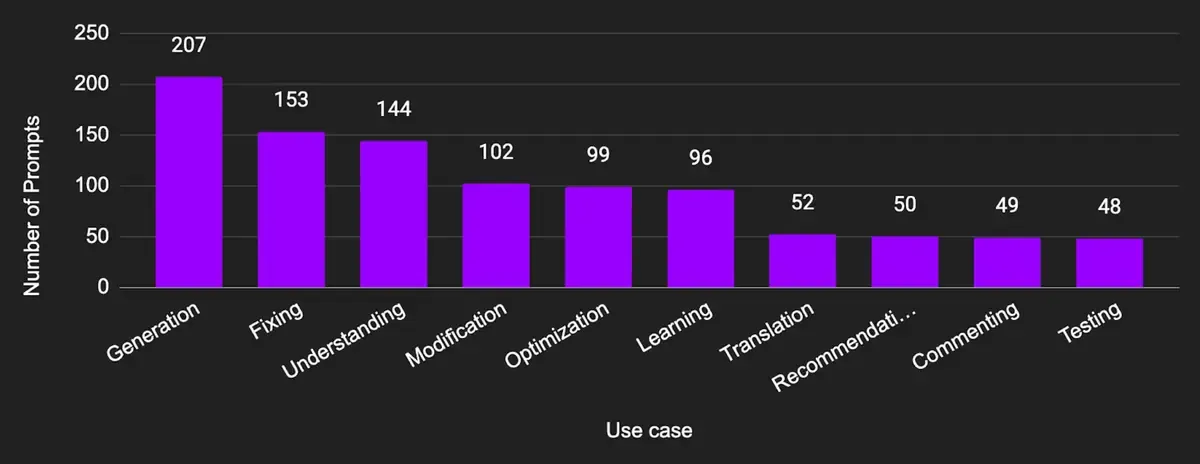
Generation | Create new code from a set of specifications or descriptions given in natural language. | 207 (20.7%) |
Fixing | Identify and correct errors in existing code. For example, debugging, resolving syntax errors and fixing logical mistakes. | 153 (15.3%) |
Understanding | Explain, interpret or clarify existing code. For example, elucidating how certain code segments work, breaking down complex algorithms. | 144 (14.4%) |
Modification | Make changes or adjustments to existing code to meet new requirements or conditions. For example, altering functionality, updating or enhancing features. | 102 (10.2%) |
Optimization | Improve the performance of existing code. For example, enhancing efficiency, reducing resource consumption (like memory or processing time). | 99 (9.9%) |
Learning | Assist with learning or understanding programming concepts, languages or tools. For example, guidance on best practices, explanation of programming concepts. | 96 (9.6%) |
Translation | Convert code from one programming language to another with code structures, styles and idioms adapted to the best practices of the target language. | 52 (5.2%) |
Recommendations | Provide suggestions or advice on coding practices, tools, libraries or frameworks. | 50 (5.0%) |
Commenting | Add or improve comments in existing code. | 49 (4.9%) |
Testing | Develop, enhance or fix tests for existing code. | 48 (4.8%) |
[coding-data-1]
Use Cases Distribution
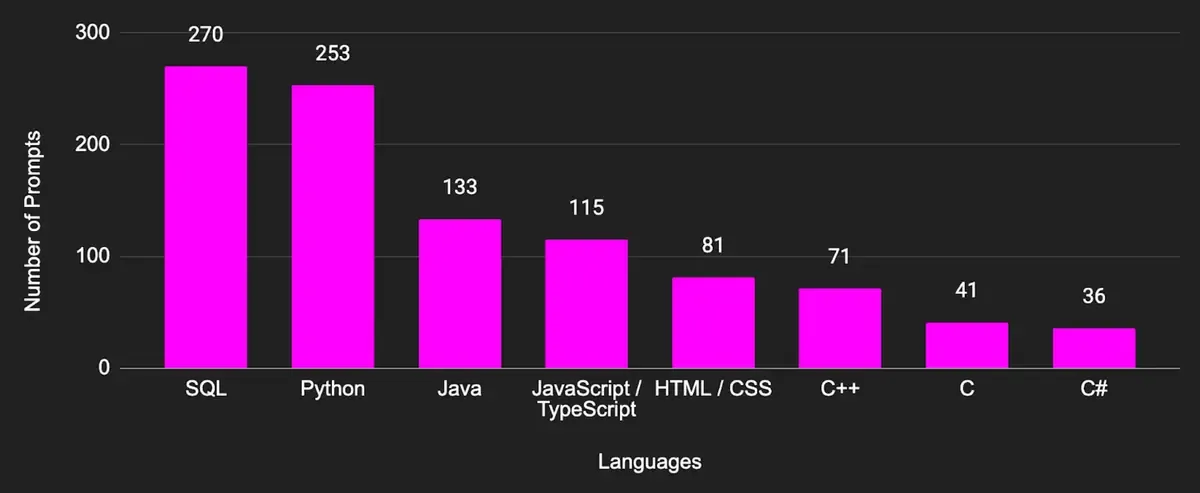
Coding Languages Distribution
The dataset was created by a group of coding annotators screened and selected for the project. They were selected on the basis of software development / programming / data science experience and qualifications, ensuring coverage of all required coding languages.
Dataset constructions steps:
Instructions creation. We generated an instruction document to guide human annotators contributors on how to generate the initial set of prompt-response pairs.
Controlled access. Contributors were prohibited from using any publicly available code or questions, including those from StackOverflow or public GitHub repositories. This prevents possible eval set contamination, ensuring the creation of novel problems the models haven’t seen in their training sets.Initial attempts. Contributors were guided to create initial attempts, an initial prompt-response set, following a predetermined distribution by coding language and programming task.
Quality Control. We designed a 2-stage pipeline:
Based on initial attempts’ quality, the operators identified a set of trusted reviewers
Trusted reviewers performed multiple review rounds to evaluate the prompt-response pairs accuracy, coherence, and relevance.
In addition to standard reviews, code execution tests on the model answers and independent audits were performed. We filtered down the initial set of 2.5k prompts to 1.5k reviewed prompts-responses.
Independent final audit. The team commissioned a set of internal independent auditors with a final review of the quality of the prompts and answers. Low quality prompts or answers were filtered out. This final screen reduced the initial set down to 1,000 quality-validated prompt-response pairs.
Evaluation Taxonomy
To capture a nuanced assessment, we created an evaluation taxonomy specific to coding tasks. Each model response was evaluated across a set of standalone criteria, covering each of the use cases, and side-by-side with another model response to measure preference ranking on a 7-point likert scale:
Prompt Adherence: Does the model strictly adhere to the given prompt and comprehend all its requirements?
Ratings: Yes, No
Correctness:
To what extent are the claims in the response truthful and correct? Verifying Correctness often requires external research.
If code was present in the response, does it execute and produce the correct output
Evaluators are encouraged to use any means possible to test code (e.g., writing simple programs to test functions and code snippets), however, Code Correctness may not be measured if, for example, the code only functions when embedded inside a large, complex program that is not provided, or if it requires an external file/API dependency that is not provided.
Ratings: Yes, No
Performance / Efficiency: Does the code execute without any performance concerns?
Ratings: Yes, No
Readability / Documentation: Is the written explanation well-structured and visually organized? Does the response include necessary documentation aiding in code understanding? Is the code readable, employing proper formatting and mnemonic variable and function names?
Ratings: Yes, No
Overall Side-by-Side: Considering the dimensions above relevant to the specific task, how does the overall quality of the two model responses compare?
Ratings: Score between 1 to 7, where 1 signifies that model 1’s response was much better than model 2’s response and 7 signifies the opposite.
Expert raters were required to provide further detailed justifications regarding (1) any model issues identified if they selected “No” in any of the above dimensions, and (2) the side-by-side rating, in an open-text format. Additionally, for all the responses that involve a nontrivial code snippet, we ask the annotators to compile and run the code in our tooling in order to fully catch compilation and runtime issues.
Evaluation Methodology
Each model is randomly paired with other models, and each pairing receives a randomly chosen prompt from the set of 1,000 prompts described above.
Each evaluation tasks consists of the following:
Two models generate the responses for a prompt
Annotators provide a point-wise evaluation of each response
Annotators express their preference between the two scores on a 7-point likert scale
To ensure thoroughness and reliability in the evaluation process, each task was executed in parallel 3 times by different human annotators. Then, the ratings were then reviewed in two stages: an initial review layer and a final review layer. The figure below provides an overview of the evaluation pipeline design. After finalizing the tasks, a team of internal independent auditors randomly selected and reviewed 10% of the tasks for quality control.
Leaderboard rankings are determined using Rank (Upper Bound), which reflects a model’s statistical position based on confidence intervals. The ranking process follows these steps:
Count the number of models that are statistically significantly better than the target model.
Add 1 to this count to determine the model’s rank.
A model is considered statistically significantly better than another if its lower-bound score (95% confidence interval) is higher than the other model’s upper-bound score.Models receive the same rank when the same number of models are statistically better than each of them. This approach groups models based on statistical significance rather than raw scores, ensuring rankings reflect meaningful performance differences.
Evaluation Methodology - Pipeline Design
Beyond producing overall ranking, this evaluation methodology enables slicing of the evaluation data by programming languages and use cases, to help highlight models’ strengths and weaknesses across different areas, to help answer questions like: how does a model perform compared to the reference model on SQL, Java, HTML/CSS, and C++ prompts? How competitive is a particular model in specific functions, from less code-intensive tasks like Understanding and Recommendations, to complex scenarios like Translation?
Acknowledgments
We extend our deepest gratitude to the dedicated team of annotators, operators and researchers who made this project possible.
Scale AI team: Dean Lee*, Edwin Pan, Johannes Mols, Mike Lunati, Antony Tokarr, Cristina Menghini, Daniel Berrios, William Qian, Kenneth Murphy, Summer Yue
Appendix A - Prompt Diversity
Controlling command diversity is essential for model evaluation because doing so exercises the versatility and comprehensiveness of the target models in handling a wide range of instructions or directives. A model with high command diversity can effectively understand and respond to various types of commands, including different task-specific instructions, requests, prompts for information, or actions to be performed. During prompt collection, frequent combinations like “create-program” were caught by automated checks and discouraged in favor of different wordings with similar meanings. To analyze command diversity for coding prompts, all code is removed such that only the natural language remains.
Performance Comparison
1237.00±31.00
o3-mini
1137.00±34.00
GPT-4o (November 2024)
1132.00±31.00
1123.00±35.00
Gemini 2.0 Flash Experimental (December 2024)
1111.00±26.00
Gemini 2.0 Pro (December 2024)
1109.00±33.00
Gemini 2.0 Flash Thinking (January 2025)
1108.00±37.00
DeepSeek R1
1100.00±31.00
o1 (December 2024)
1083.00±30.00
1079.00±22.00
1045.00±25.00
GPT-4o (May 2024)
1036.00±24.00
GPT-4 Turbo Preview
1034.00±22.00
Claude 3 Opus
959.00±26.00
Mistral Large 2
1029.00±23.00
Llama 3.1 405B Instruct
1022.00±24.00
1007.00±26.00
Gemini 1.5 Pro (May 2024)
994.00±25.00
GPT-4 (November 2024)
992.00±28.00
Deepseek V3
985.00±25.00
Llama 3.2 90B Vision Instruct
984.00±30.00
Gemini 1.5 Flash
943.00±26.00
Gemini 1.5 Pro (April 2024)
891.00±32.00
Claude 3 Sonnet
879.00±31.00
Llama 3 70B Instruct
871.00±26.00
Mistral Large
811.00±25.00
Gemini 1.0 Pro
685.00±34.00
CodeLlama 34B Instruct
598.00±38.00
* Ranking is based on Rank(UB)