Scene 1
nuScenes by Motional
Large-scale open source dataset for autonomous driving.
For commercial use, please visit the nuScenes website directly.
Overview
Support for computer vision and autonomous driving research
Data Collection
Careful scene planning by Motional
Car Setup
Vehicle, Sensor and Camera Details
- 6
- 12Hz capture frequency
- Evetar Lens N118B05518W F1.8 f5.5mm 1/1.8"
- 1/1.8" CMOS sensor of 1600x1200 resolution
- Bayer8 format for 1 byte per pixel encoding
- 1600x900 ROI is cropped from the original resolution to reduce processing and transmission bandwidth
- Auto exposure with exposure time limited to the maximum of 20 ms
- Images are unpacked to BGR format and compressed to JPEG
Cameras - 1
- 20Hz capture frequency
- 32 beams, 1080 (+-10) points per ring
- 32 channels
- 360° Horizontal FOV, +10° to -30° Vertical FOV, uniform azimuth angles
- 80m-100m Range, Usable returns up to 70 meters, ± 2 cm accuracy
- Up to ~1.39 Million Points per Second
Spinning LiDAR - 5
- 77GHz
- 13Hz capture frequency
- Independently measures distance and velocity in one cycle using Frequency Modulated Continuous Wave
- Up to 250m distance
- Velocity accuracy of ±0.1 km/h
Long Range RADAR Sensor
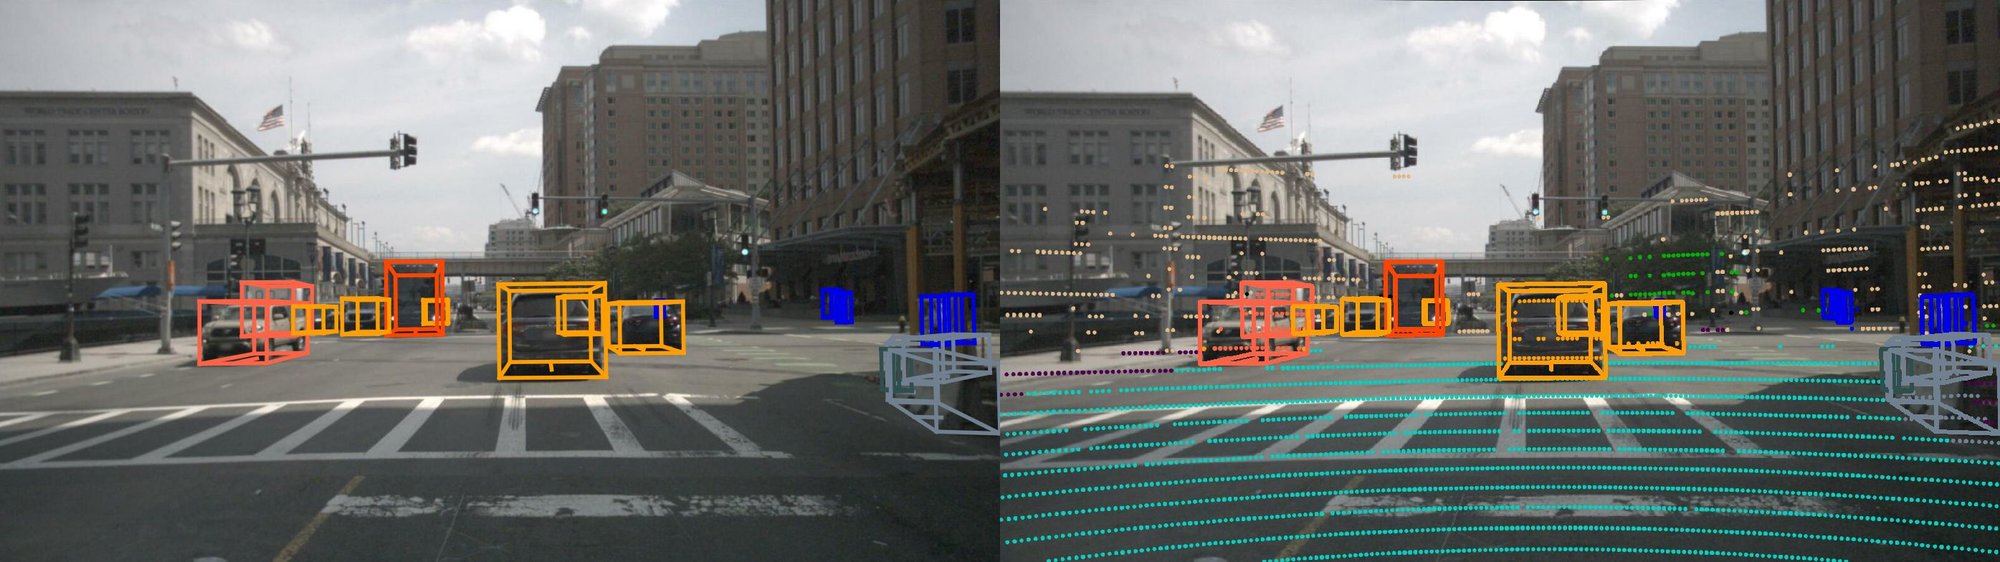
Flythrough of the nuScenes Teaser
Sensor Calibration
Our multi-sensor dataset uses sensors that have been calibrated for the extrinsics and intrinsics of every sensor
LiDAR extrinsics
Camera extrinsics
Camera intrinsic calibration
IMU extrinsics

Sensor Synchronization
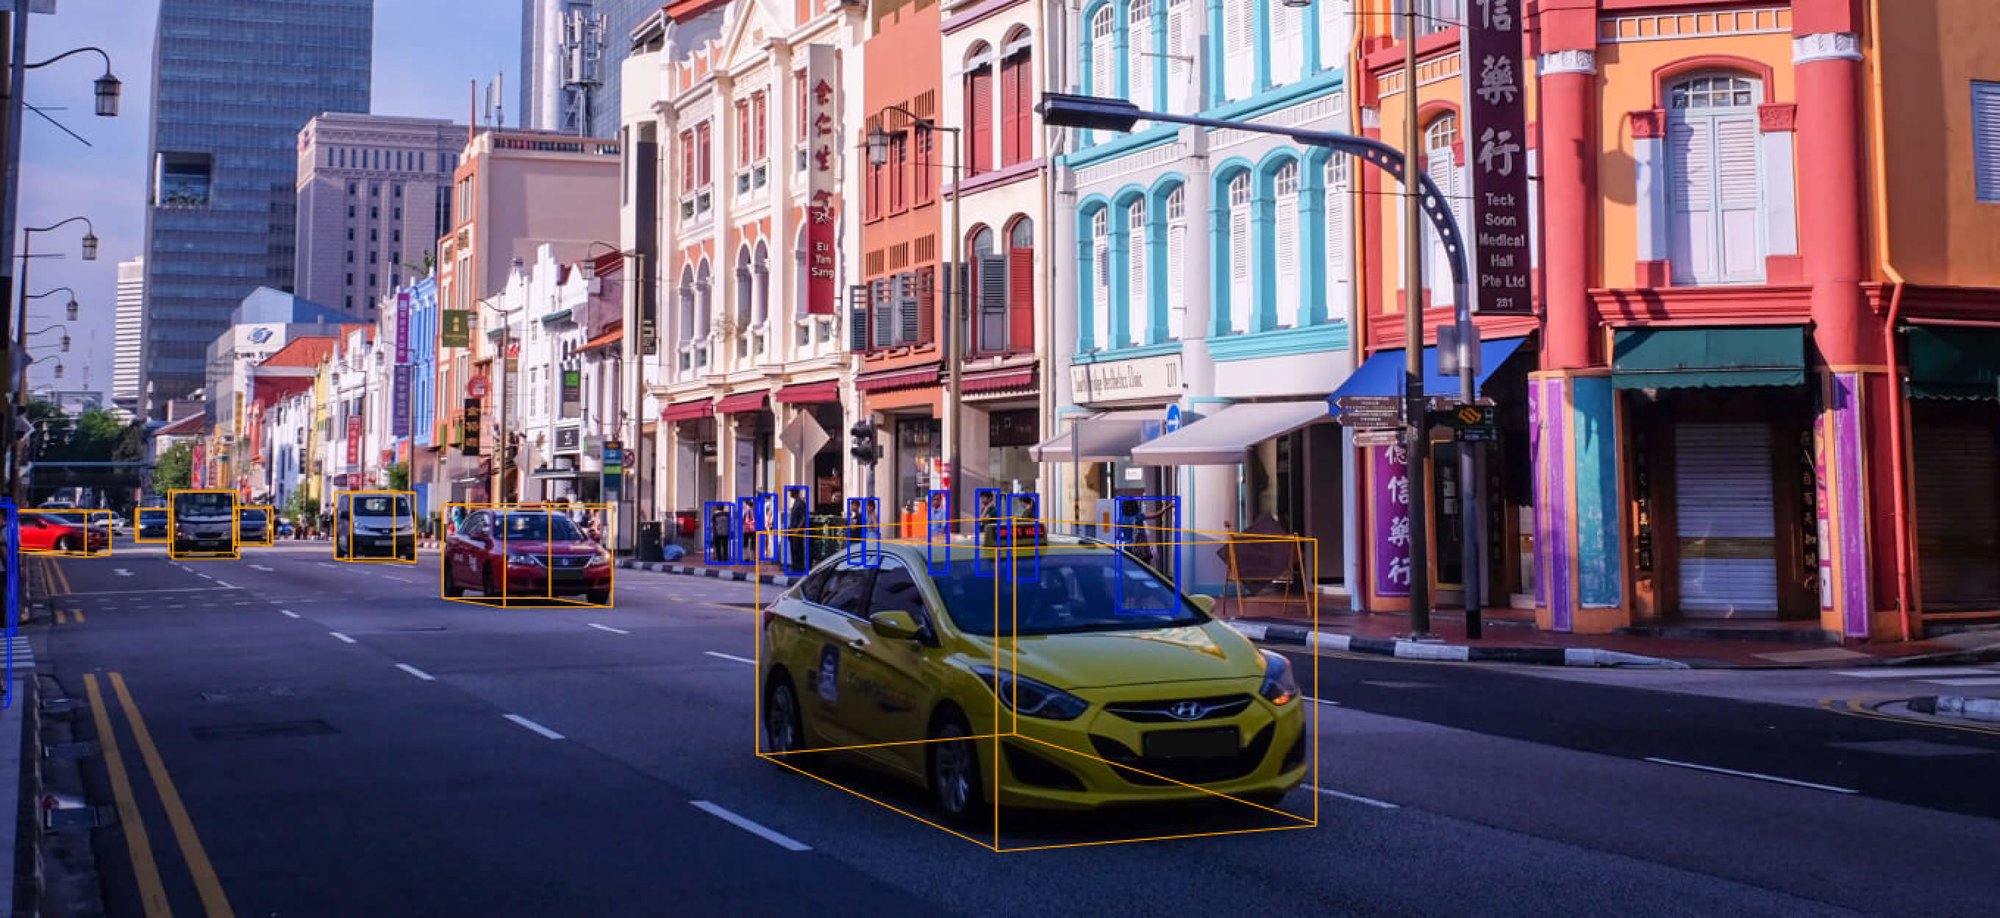
Data Annotation
Complex Label Taxonomy
Instances Per Label
493,322
vehicle.car
208,240
human.pedestrian.adult
152,087
movable_object.barrier
208,240
movable_object.trafficcone
88,519
vehicle.truck
24,860
vehicle.trailer
14,671
vehicle.construction
14,501
vehicle.bus.rigid